Your CFO knows exactly what the company pays in taxes. Property tax, payroll tax, sales tax, and every percentage point gets scrutinized, modeled, and minimized. But there’s another tax bleeding your organization that rarely shows up in financial reviews: the retention tax. I’ll make my case.
Most mid-market companies operate with 10-20% annual turnover and consider it healthy churn. The logic seems sound. Some attrition keeps the talent pool fresh, prevents stagnation, and creates room for promotions. Finance signs off because the recruiting budget looks reasonable. HR points to industry benchmarks showing everyone else runs similar numbers.
But here’s what those benchmarks miss: turnover isn’t just a line item in your recruiting budget. It’s a structural tax on your organization’s productive capacity. And when you actually model what 15% annual turnover does to a company over time, the math is devastating.
A 500-person company running 15% annual turnover isn’t just replacing 75 people per year. It’s operating with roughly 30-40% less productive capacity than its headcount suggests. That’s the equivalent of employing 500 people but only getting output from 300-350. The other 150-200 people worth of capacity? Gone. Paid for, but not delivered.
Let’s figure out why this happens, what it actually costs, and when turnover stops being healthy friction and starts destroying organizational capability.
The productivity math nobody runs
When someone leaves your company, the impact isn’t binary. They’re here one day, gone the next, replaced, back to normal. The productivity loss follows a specific pattern that compounds in ways most companies never calculate.
Start with the departing employee. Gallup research found that the average employee takes 12 months to reach full productivity in a new role, but that timeline varies significantly by position complexity. For entry-level roles, it’s 1-3 months. Mid-level positions need 3-6 months. Senior and technical roles can take 6-12 months. Sales account executives average 4.9 months to full productivity.
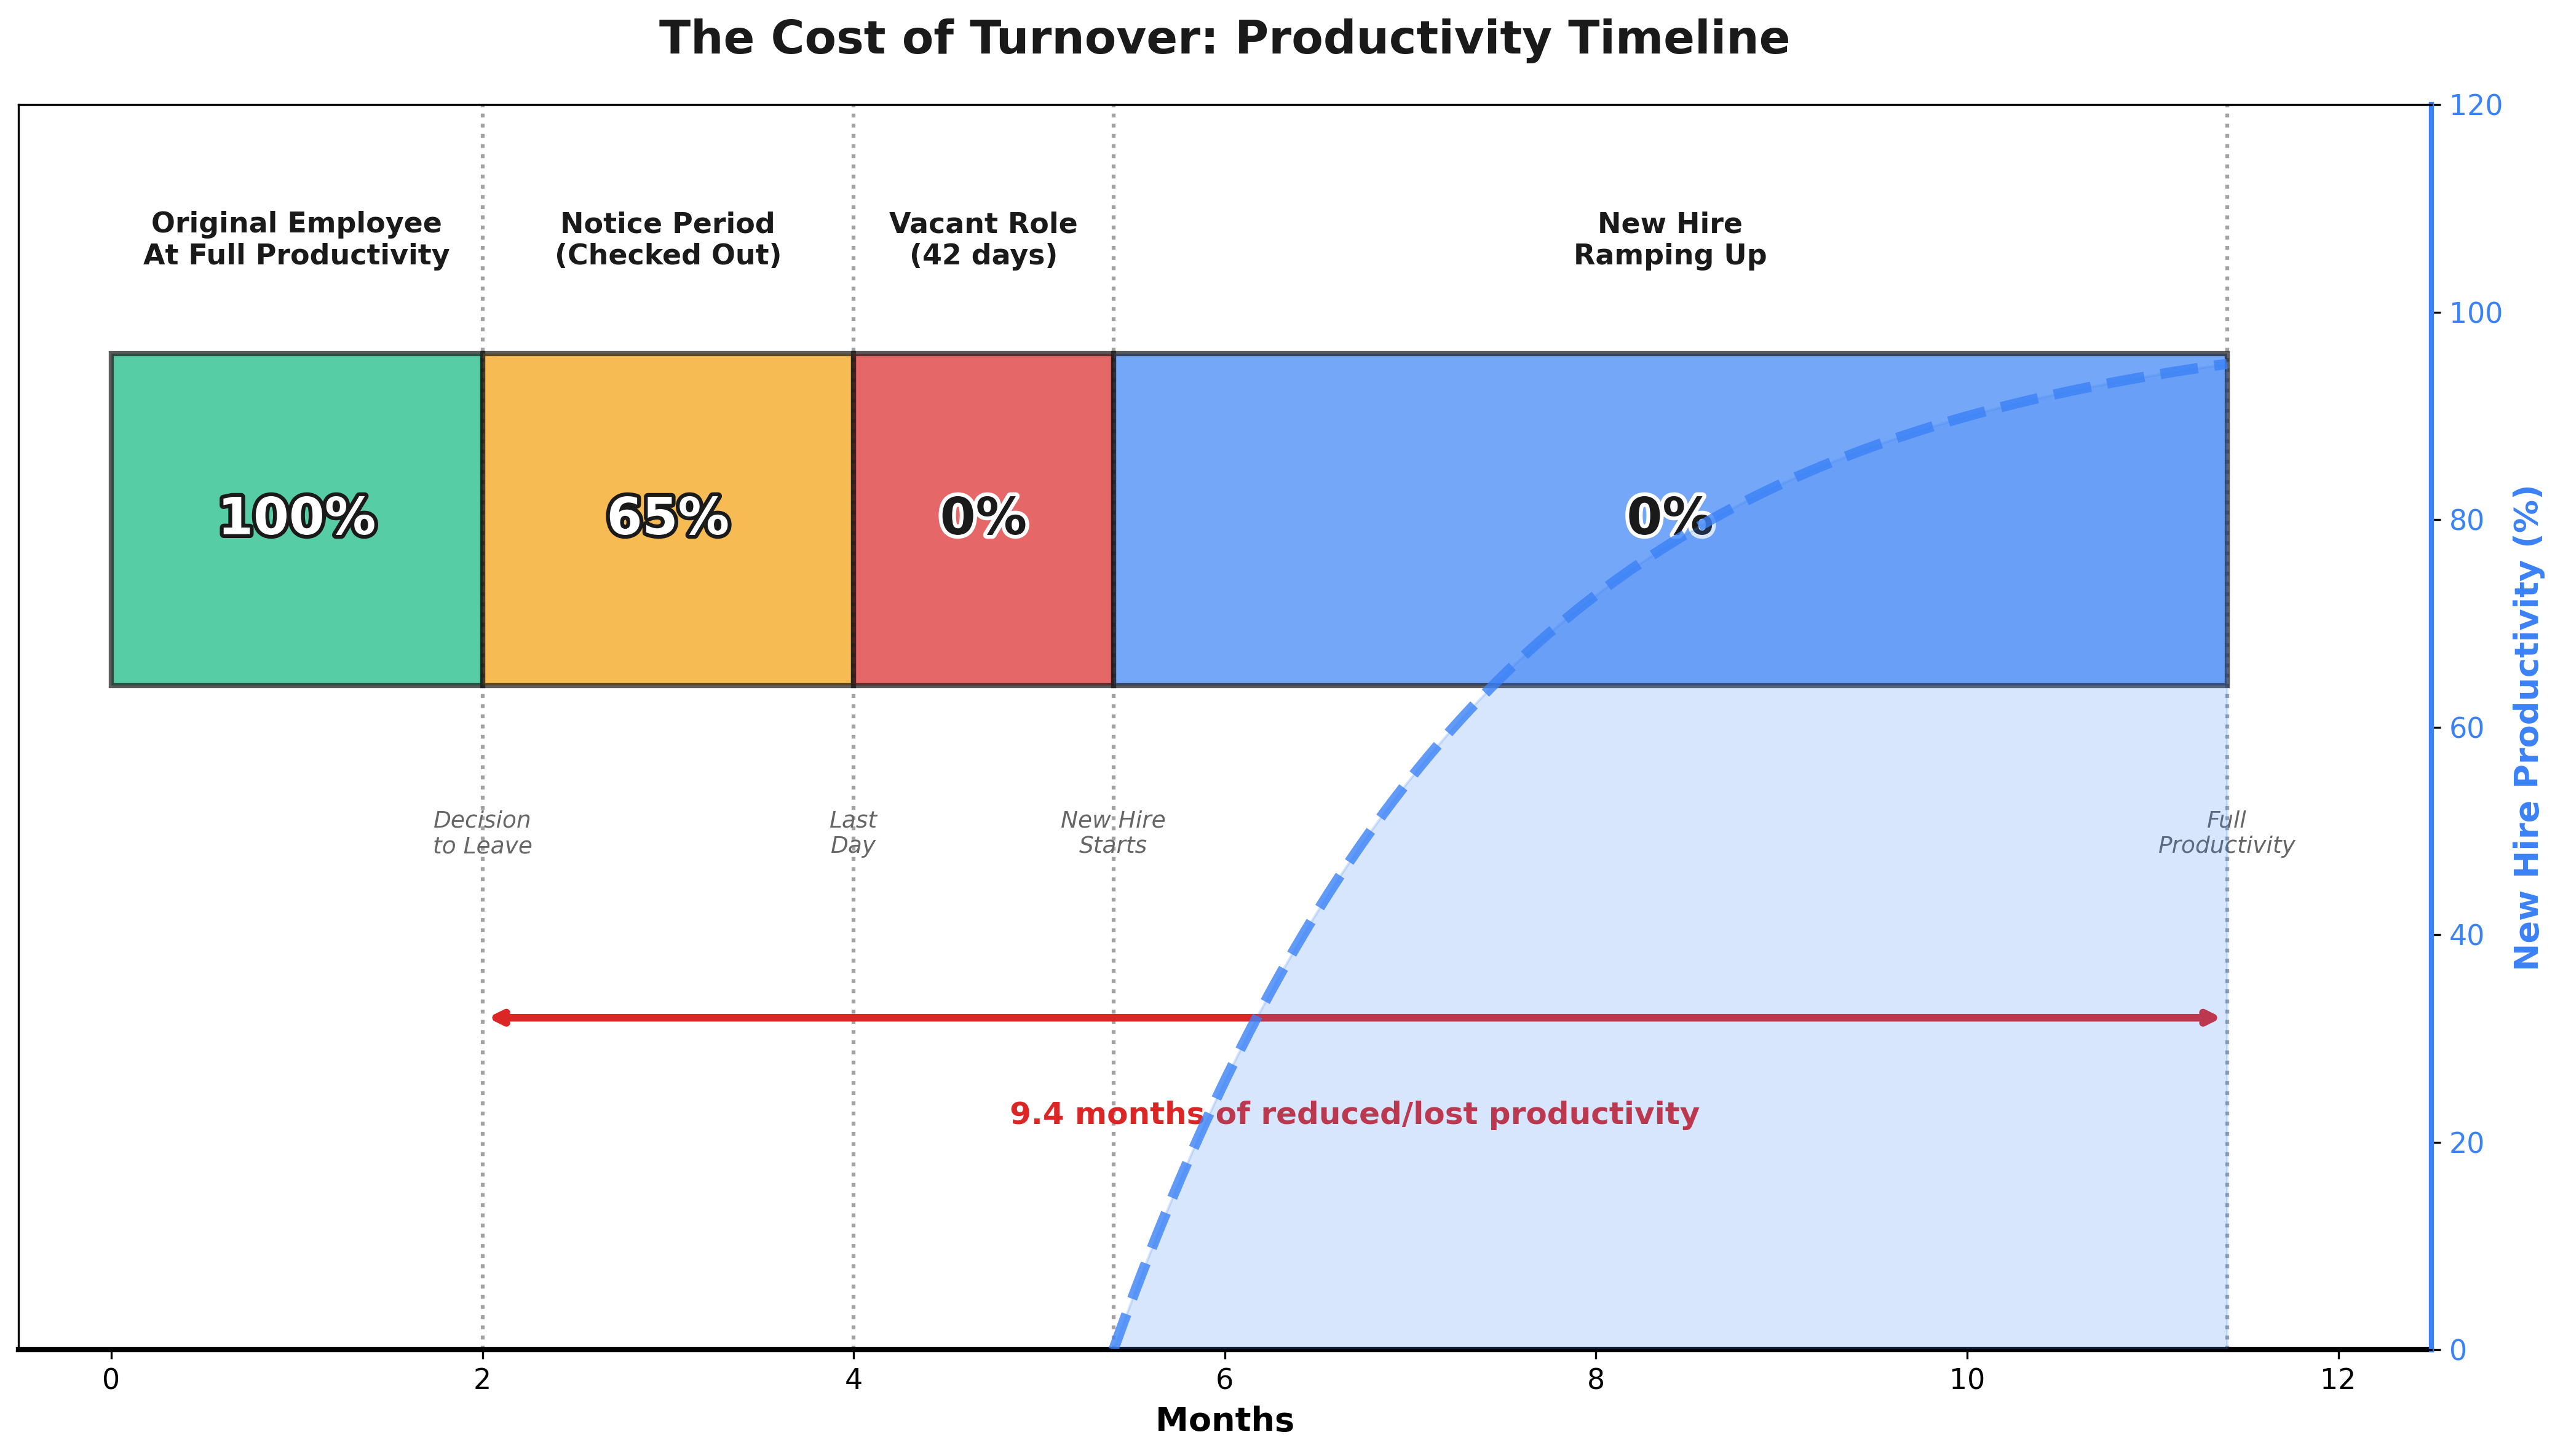
Here’s what matters: your departing employee has already climbed that curve. They’re operating at or near 100% capacity. But they don’t stay there until their last day.
Once someone decides to leave, and this is whether they’ve told you yet or not, productivity starts declining. They’re mentally checked out, wrapping up projects, documenting for transition, and training replacements. In their final 4-8 weeks, you’re getting maybe 60-70% productivity. Some of that time is probably actively negative even. They’re creating work for others rather than completing their own.
Then they’re gone. The role sits empty for an average of 42 days, according to SHRM data. During that period, you’re at 0% productivity for that position, though you’re probably paying overtime or stretching other team members to cover critical functions at reduced efficiency.
Now the new hire arrives. You’re paying full salary from day one, but you’re not getting full productivity. For the first month, you might see 25-30% output while they’re learning systems, meeting people, understanding processes. Month two, maybe 50%. Month three, 70%. If you’re lucky and the role isn’t too complex, they hit 90% by month four or five.
Do the math on a typical mid-level position with a 5-month ramp time:
- Departing employee’s final 2 months: 70% productivity
- Vacant role: 0% productivity for 1.5 months
- New hire months 1-5: 25%, 40%, 60%, 75%, 90% productivity
Average productivity across this 8.5-month transition: 48%.
You paid for 8.5 months of full salary. You received 4 months of actual output. The other 4.5 months? That’s the retention tax.
Why 15% turnover costs you 35% capacity
Now multiply this pattern across your organization. A 500-person company running 15% annual turnover is replacing 75 people every year. With an average 8-month disruption per departure (including ramp time), you’re constantly operating with 50 positions in some state of transition.
Fifty people at an average 50% productivity during transition equals 25 full-time equivalents of lost capacity. That’s 5% of your workforce producing nothing despite being on payroll.
But that’s just the direct math. The real retention tax includes three multiplier effects that push the actual capacity loss much higher.
First, the productivity hit isn’t isolated to the transitioning role. Knowledge loss affects everyone who worked with that person. The product manager who left took with her the context for why certain features were built the way they were. The engineer who departed was the only one who really understood that critical integration. The account executive who quit had relationships with your top 10 clients that can’t be transferred in a handoff doc.
Research from SHRM indicates that 60-70% of turnover costs are these “soft costs”—lost institutional knowledge, disrupted team dynamics, reduced quality from coverage gaps. When you lose someone, their team doesn’t just cover their tasks, they do it less efficiently. Projects slow down. Decisions get delayed because the person who understood the history isn’t there anymore. A knowledge worker who produces $150,000 in annual value doesn’t just take their $150,000 with them—they reduce the team’s collective output by creating friction, duplicated effort, and mistakes.
Second, turnover clusters. One departure triggers others. An engineer leaves, their work gets distributed to the team, workload increases, someone else starts looking. A top salesperson quits, team morale drops, two more update their LinkedIn profiles. The research is clear: when employees see colleagues leaving, their own likelihood of departure increases significantly. Each exit makes the next one more likely.
Third, replacement quality varies. You’re not always replacing people with exact equivalents. Time pressure drives compromises. The urgency to fill the role means you might hire someone at 80% of the capability level you lost. Do this across enough positions and you’ve downgraded your talent density without realizing it. Some turnover improves the team by replacing underperformers, but most turnover is neutral or negative on the capability curve.
When you factor in knowledge loss, turnover clustering, and quality variance, a 15% turnover rate doesn’t cost you 15% capacity—it costs you 30-40%.
The retention tax curve
Let’s make this concrete with a realistic scenario: a 500-person software company with median salary of $90,000.
Annual payroll: $45 million
Turnover rate: 15% (75 departures per year)
Direct replacement costs (using SHRM’s $4,700 average cost per hire):
- Recruiting/hiring: $352,500
- Training/onboarding: $73,950 (using TrainingMag’s $986 per learner)
- Total direct costs: $426,450
Most companies stop here. They budget for recruiting and training, consider turnover handled.
But now add the productivity loss during transition:
- 75 positions × 8.5 months average transition × 50% average productivity loss
- 75 positions × 8.5 months × $7,500 monthly salary × 50% = $2,390,625 in lost productivity during ramp
Add the knowledge loss multiplier on remaining team:
- Conservative estimate: each departure reduces team productivity by 5% for their immediate working group (average 6 people)
- 75 departures × 6 affected people × $90,000 salary × 5% × 3 months to restabilize = $1,518,750
Add the clustering effect:
- Research shows high turnover environments have 18-43% higher subsequent turnover (Gallup)
- At 15% base turnover, clustering effect adds approximately 4% additional departures
- 4% × 500 people = 20 additional unplanned departures
- 20 × ($4,700 + $986 + productivity loss) = additional $650,000
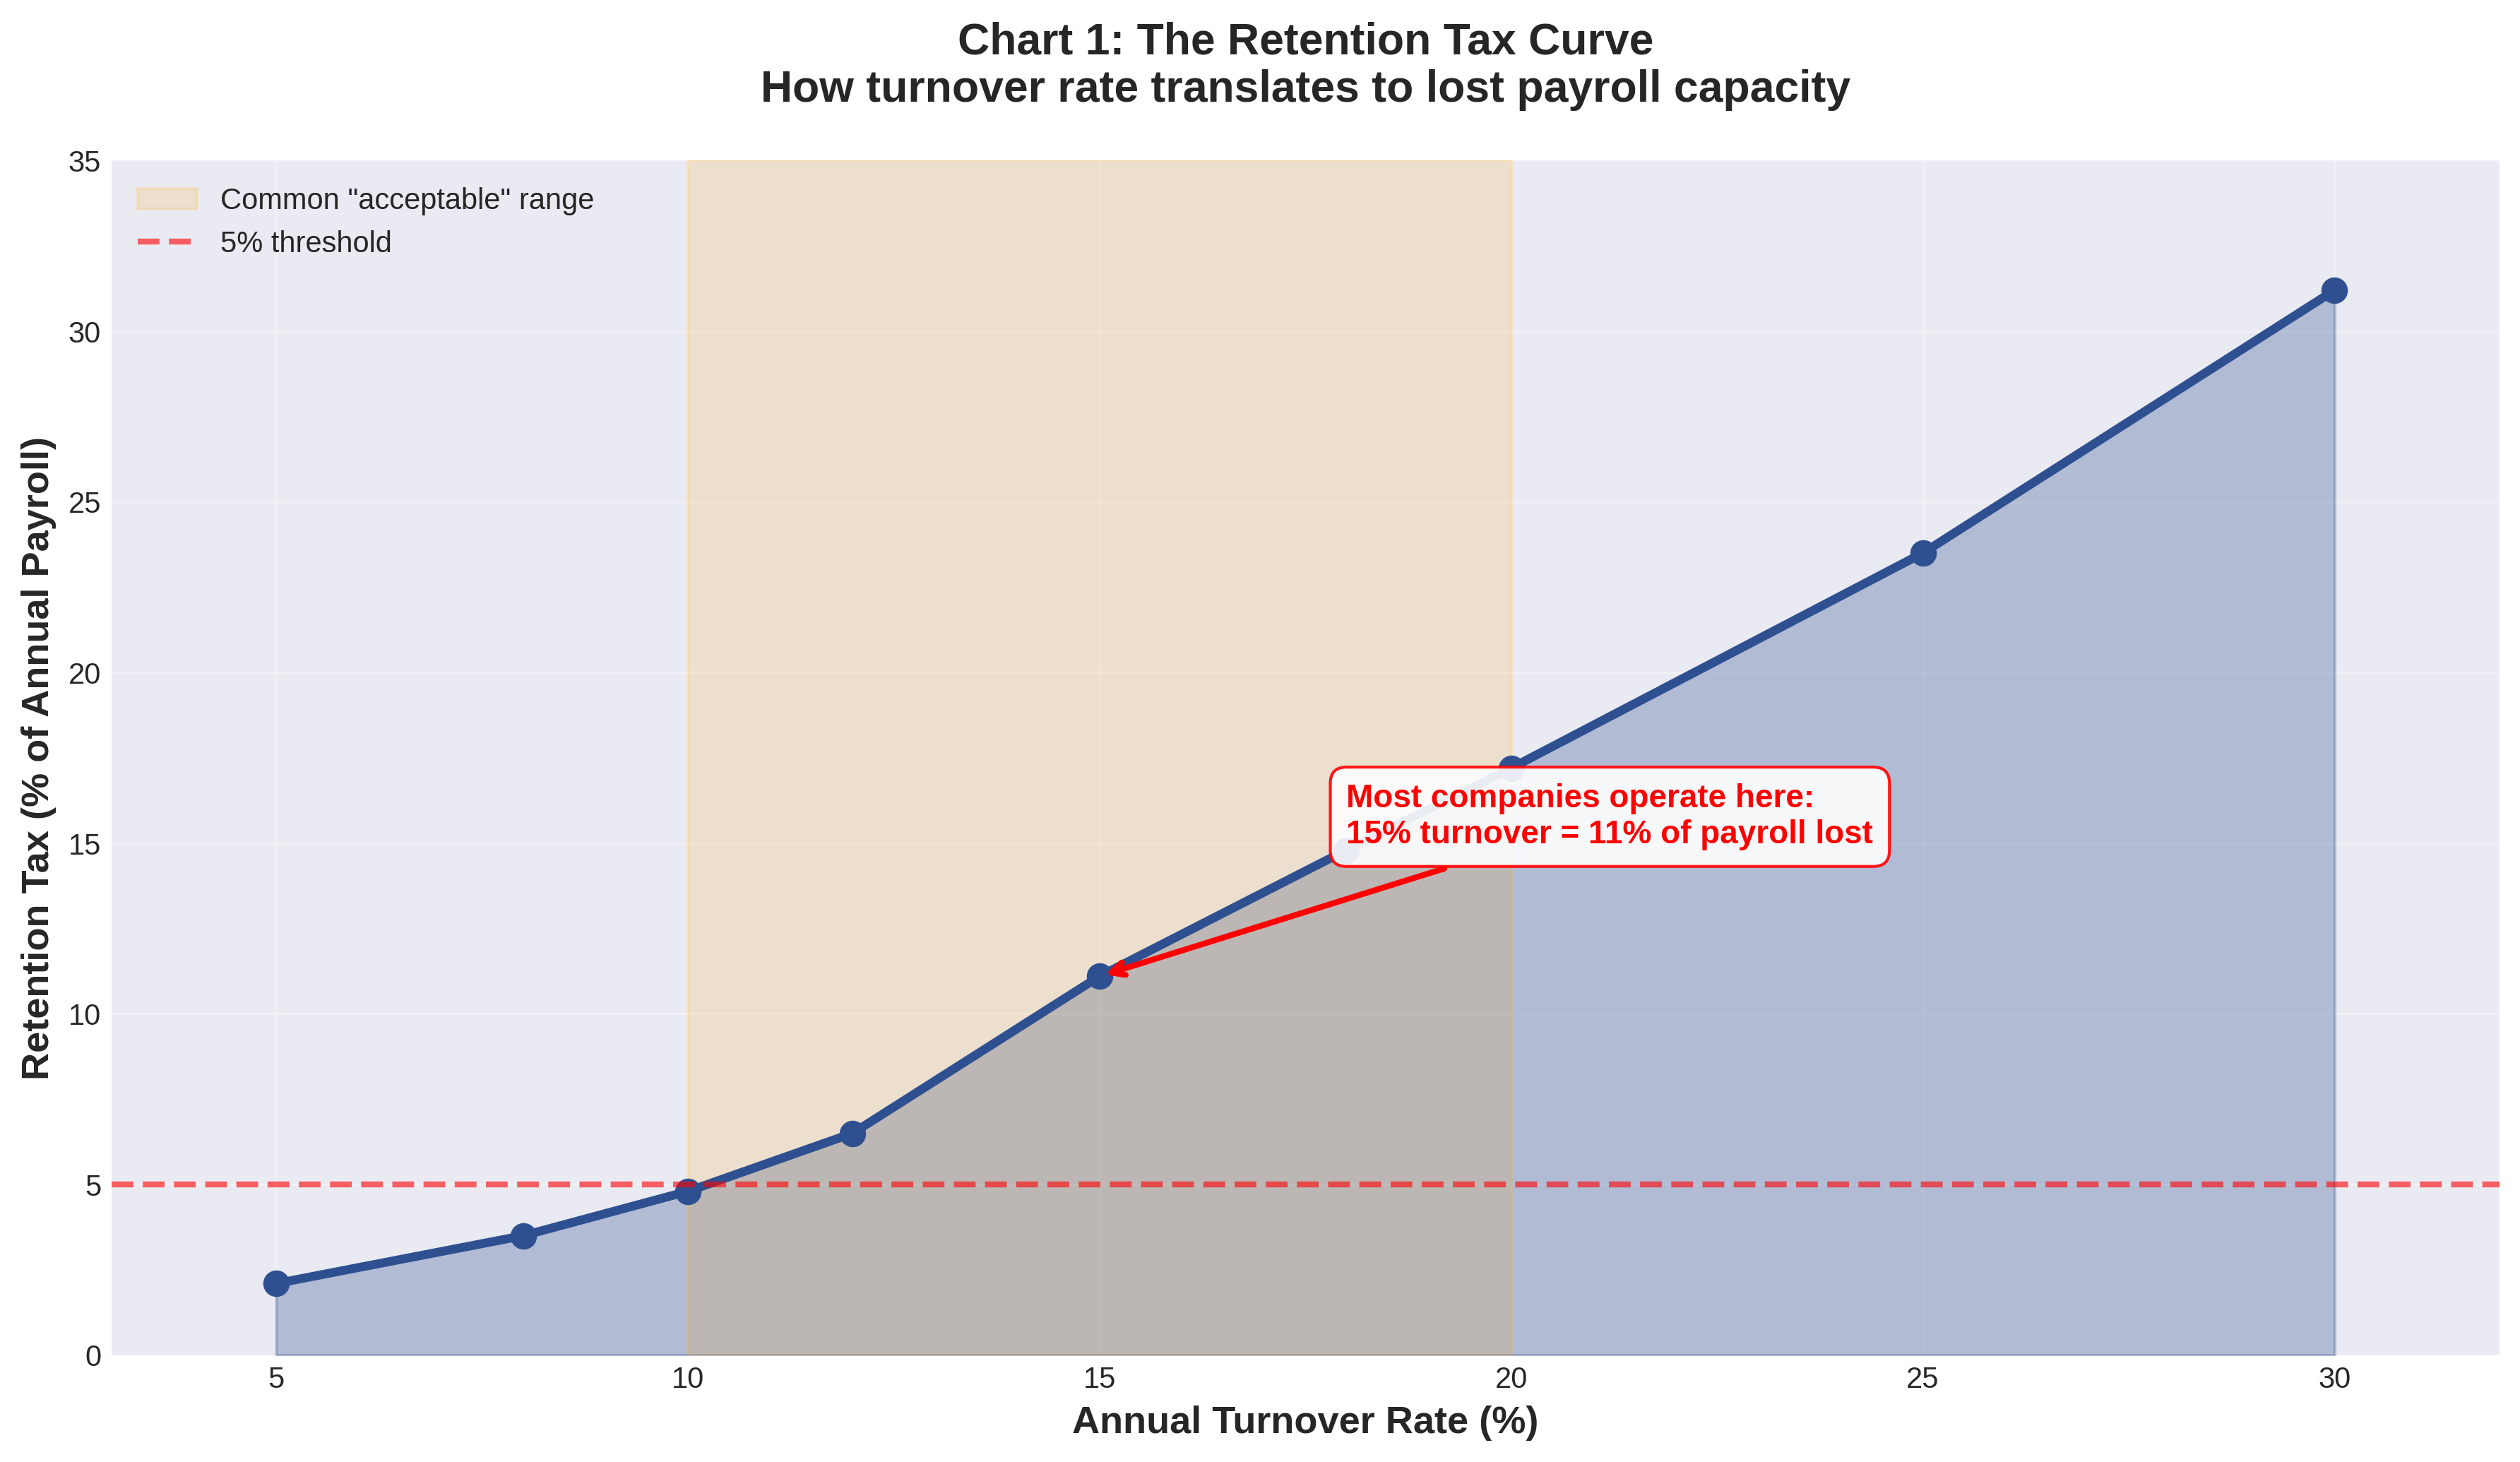
Total retention tax: $4,985,825
That’s 11% of your annual payroll. Gone! Not invested in growth, not returned to shareholders, not available for raises or R&D. Just lost to the structural cost of replacing people.
And this is with a 15% turnover rate that most executives would consider acceptable.
When turnover stops being healthy
The counterargument is obvious: some turnover is good. You need to clear out underperformers, make room for fresh thinking, prevent organizational sclerosis.
This is true. A 0% turnover rate would be terrible. But there’s a massive difference between strategic, managed attrition and the passive acceptance of double-digit churn rates.
Research from Gallup suggests that turnover below 10% is healthy for most organizations. But “healthy” doesn’t mean “optimal for your specific business.” The right retention target depends on your business model, growth stage, and margin structure.
Consider three different scenarios:
High-margin, knowledge-intensive business (consulting, software, specialized manufacturing):
- Productivity is driven by accumulated expertise and client relationships
- Knowledge loss has severe compounding effects
- Optimal turnover: 5-8%
- Each percentage point above this threshold costs 2-3% in productive capacity
Moderate-margin, process-driven business (financial services, healthcare administration, mid-market B2B):
- Mix of institutional knowledge and systematic processes
- Productivity depends on both expertise and following established procedures
- Optimal turnover: 8-12%
- Higher tolerance for turnover in junior roles, very low tolerance in senior positions
Lower-margin, high-volume business (retail, hospitality, certain customer service roles):
- Productivity driven more by process compliance than accumulated knowledge
- Shorter ramp times due to simpler role requirements
- Optimal turnover: 12-20% (though industry averages run much higher)
- Focus retention efforts on management and key operational roles, accept higher frontline churn
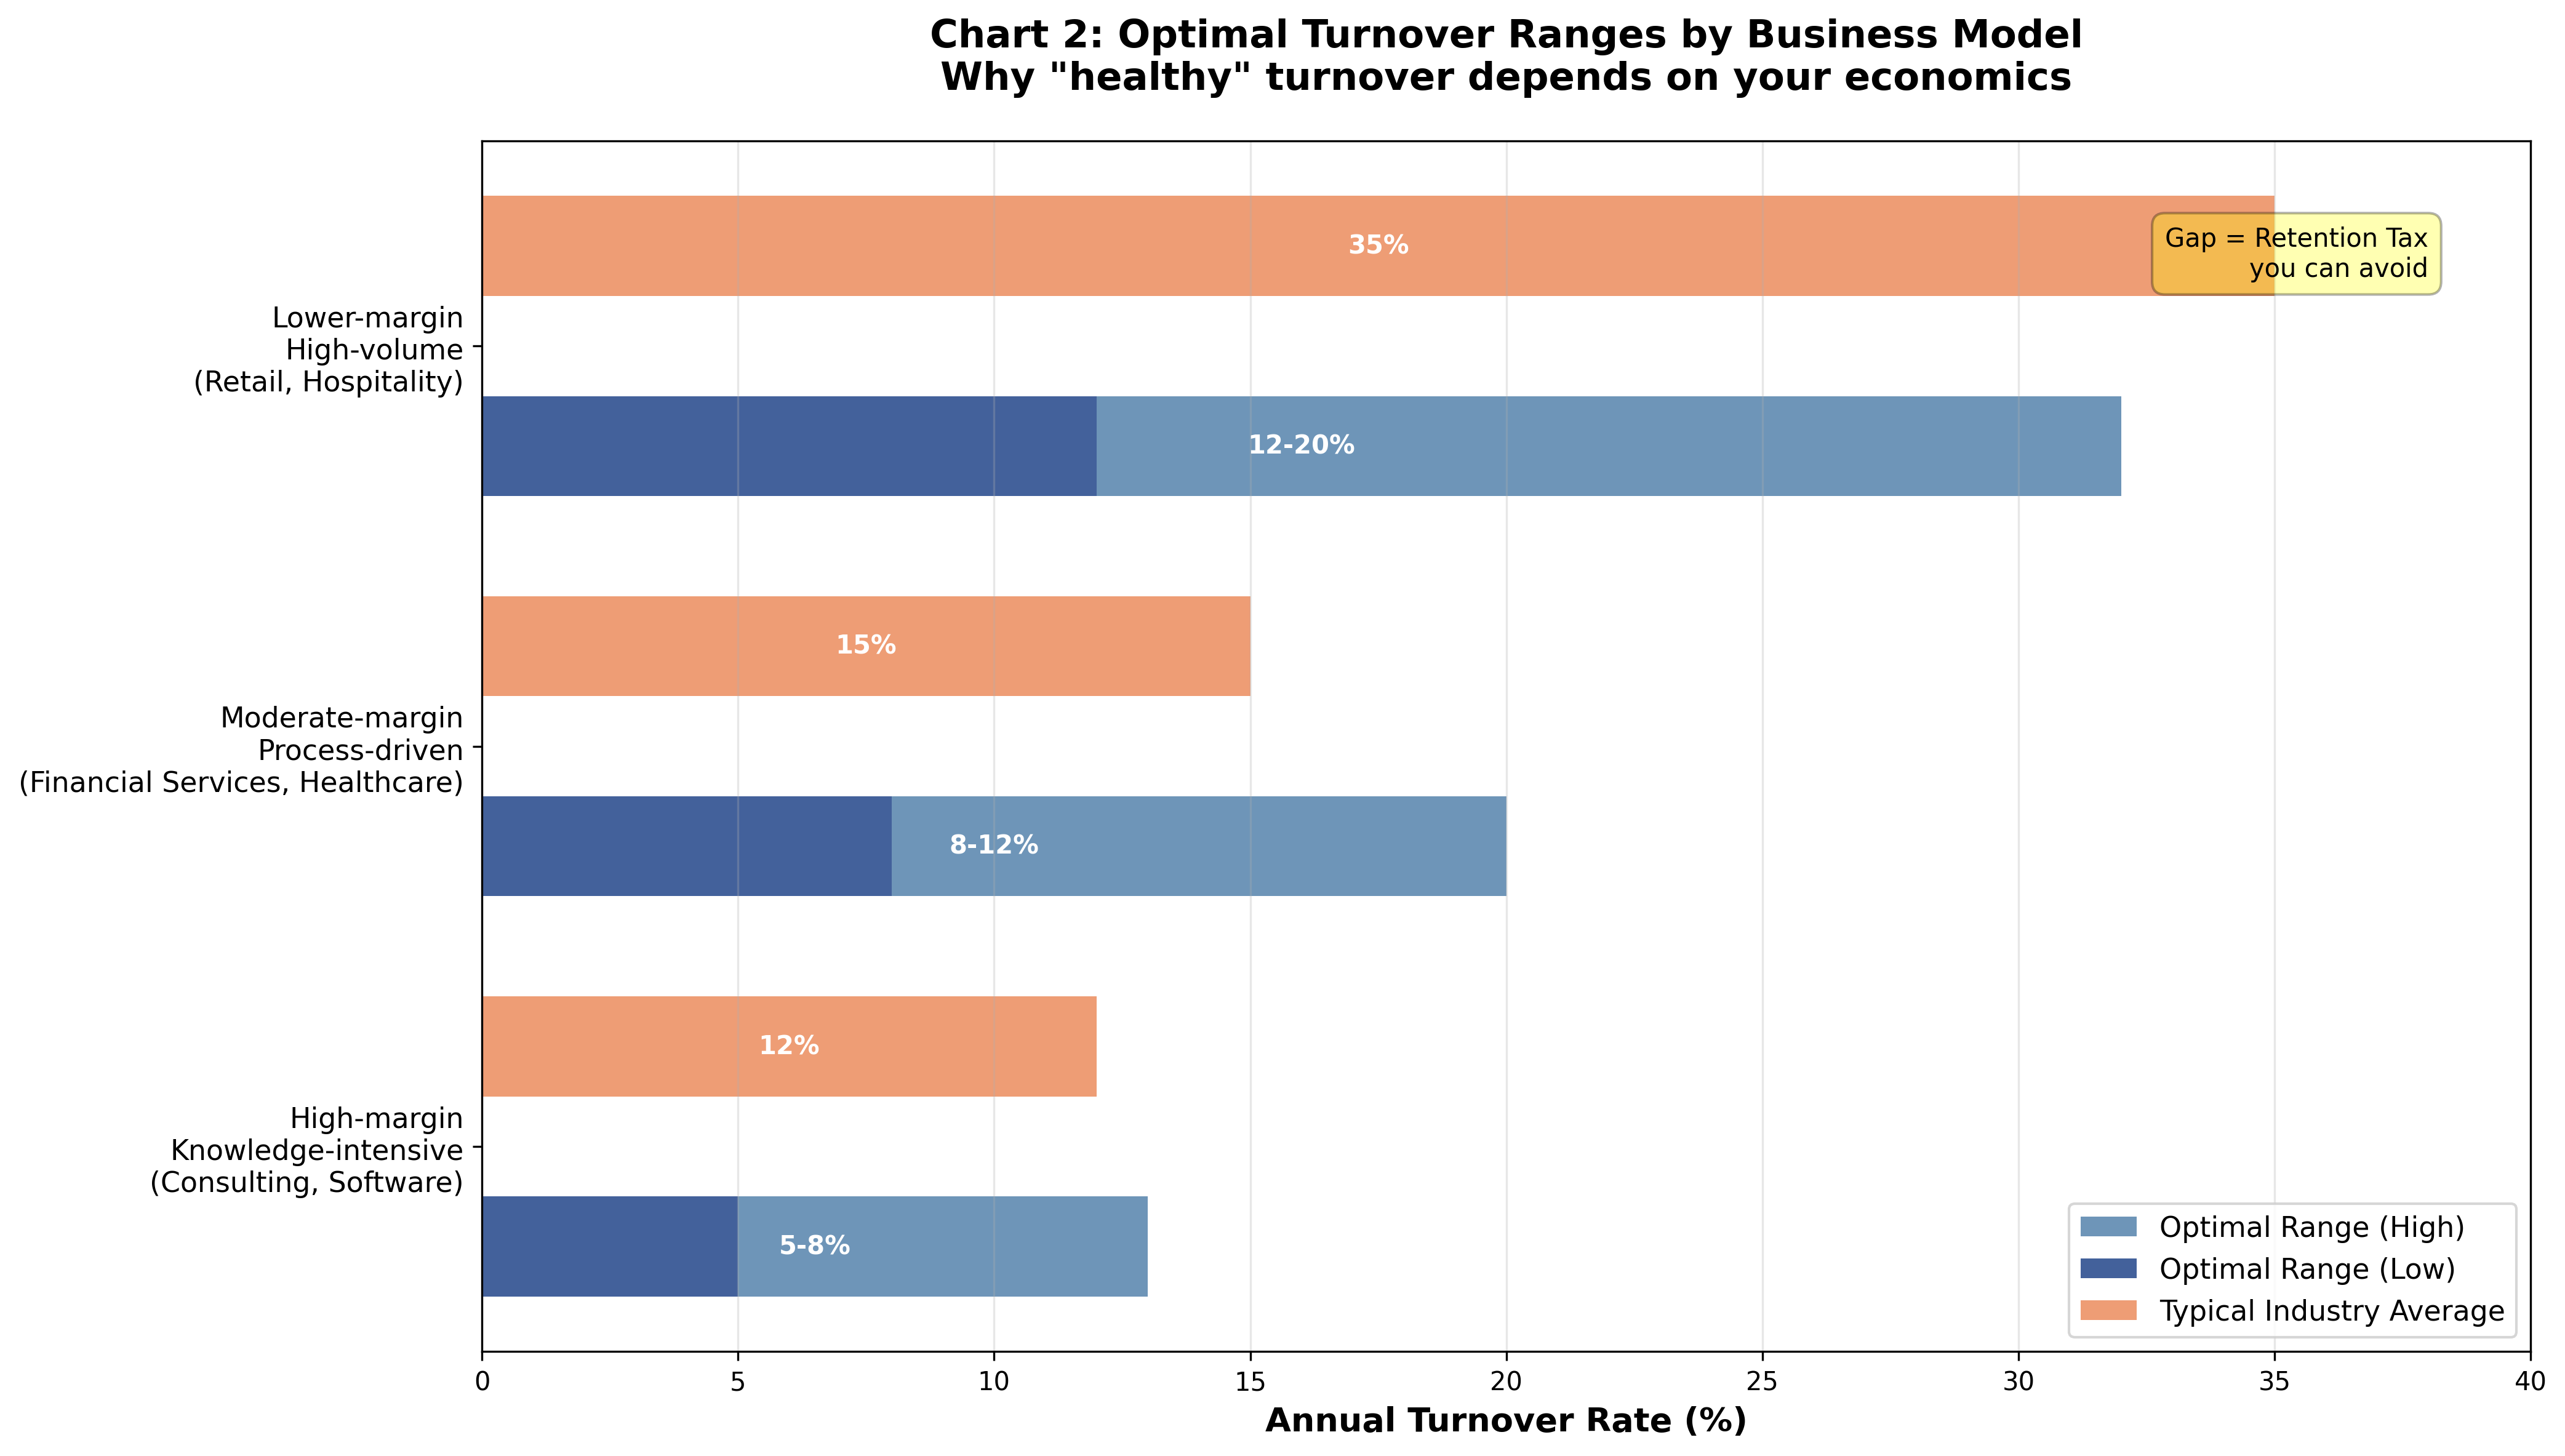
The pattern is clear: the more your business model depends on accumulated knowledge, specialized expertise, and complex relationships, the more punishing turnover becomes. A consulting firm running 20% turnover is hemorrhaging capability. A retail operation running 20% turnover might be well-managed given industry dynamics.
But here’s what matters: most companies don’t consciously choose their turnover rate. They inherit it from industry norms, accept it as “how things are,” and never calculate whether that rate is optimal for their specific economics.
The diagnostic: Is your turnover destroying capacity?
Here’s how to figure out if your retention tax is reasonable or ruinous:
Step 1: Calculate your true cost per departure
Don’t use industry averages. Model your actual economics:
- Direct costs: Recruiting, hiring, training (you already track these)
- Productivity loss during transition: (Average ramp time in months) × (Monthly salary) × (50% average productivity loss during transition)
- Knowledge loss impact: (Number of people who worked directly with departed employee) × (Their monthly salary) × (Estimated productivity hit) × (Months to restabilize)
- Clustering effect: (Additional departures triggered) × (Cost per departure)
For most knowledge-intensive businesses, the true cost per departure is 75-150% of annual salary. For leadership positions, it can exceed 200%.
Step 2: Calculate your retention tax as percentage of payroll
(Number of departures) × (True cost per departure) ÷ (Total payroll) = Retention tax rate
If this number exceeds 5% of payroll, you’re spending more on turnover than most companies spend on sales and marketing as a percentage of revenue.
Step 3: Analyze turnover distribution
Your overall rate obscures what’s actually happening. Break it down:
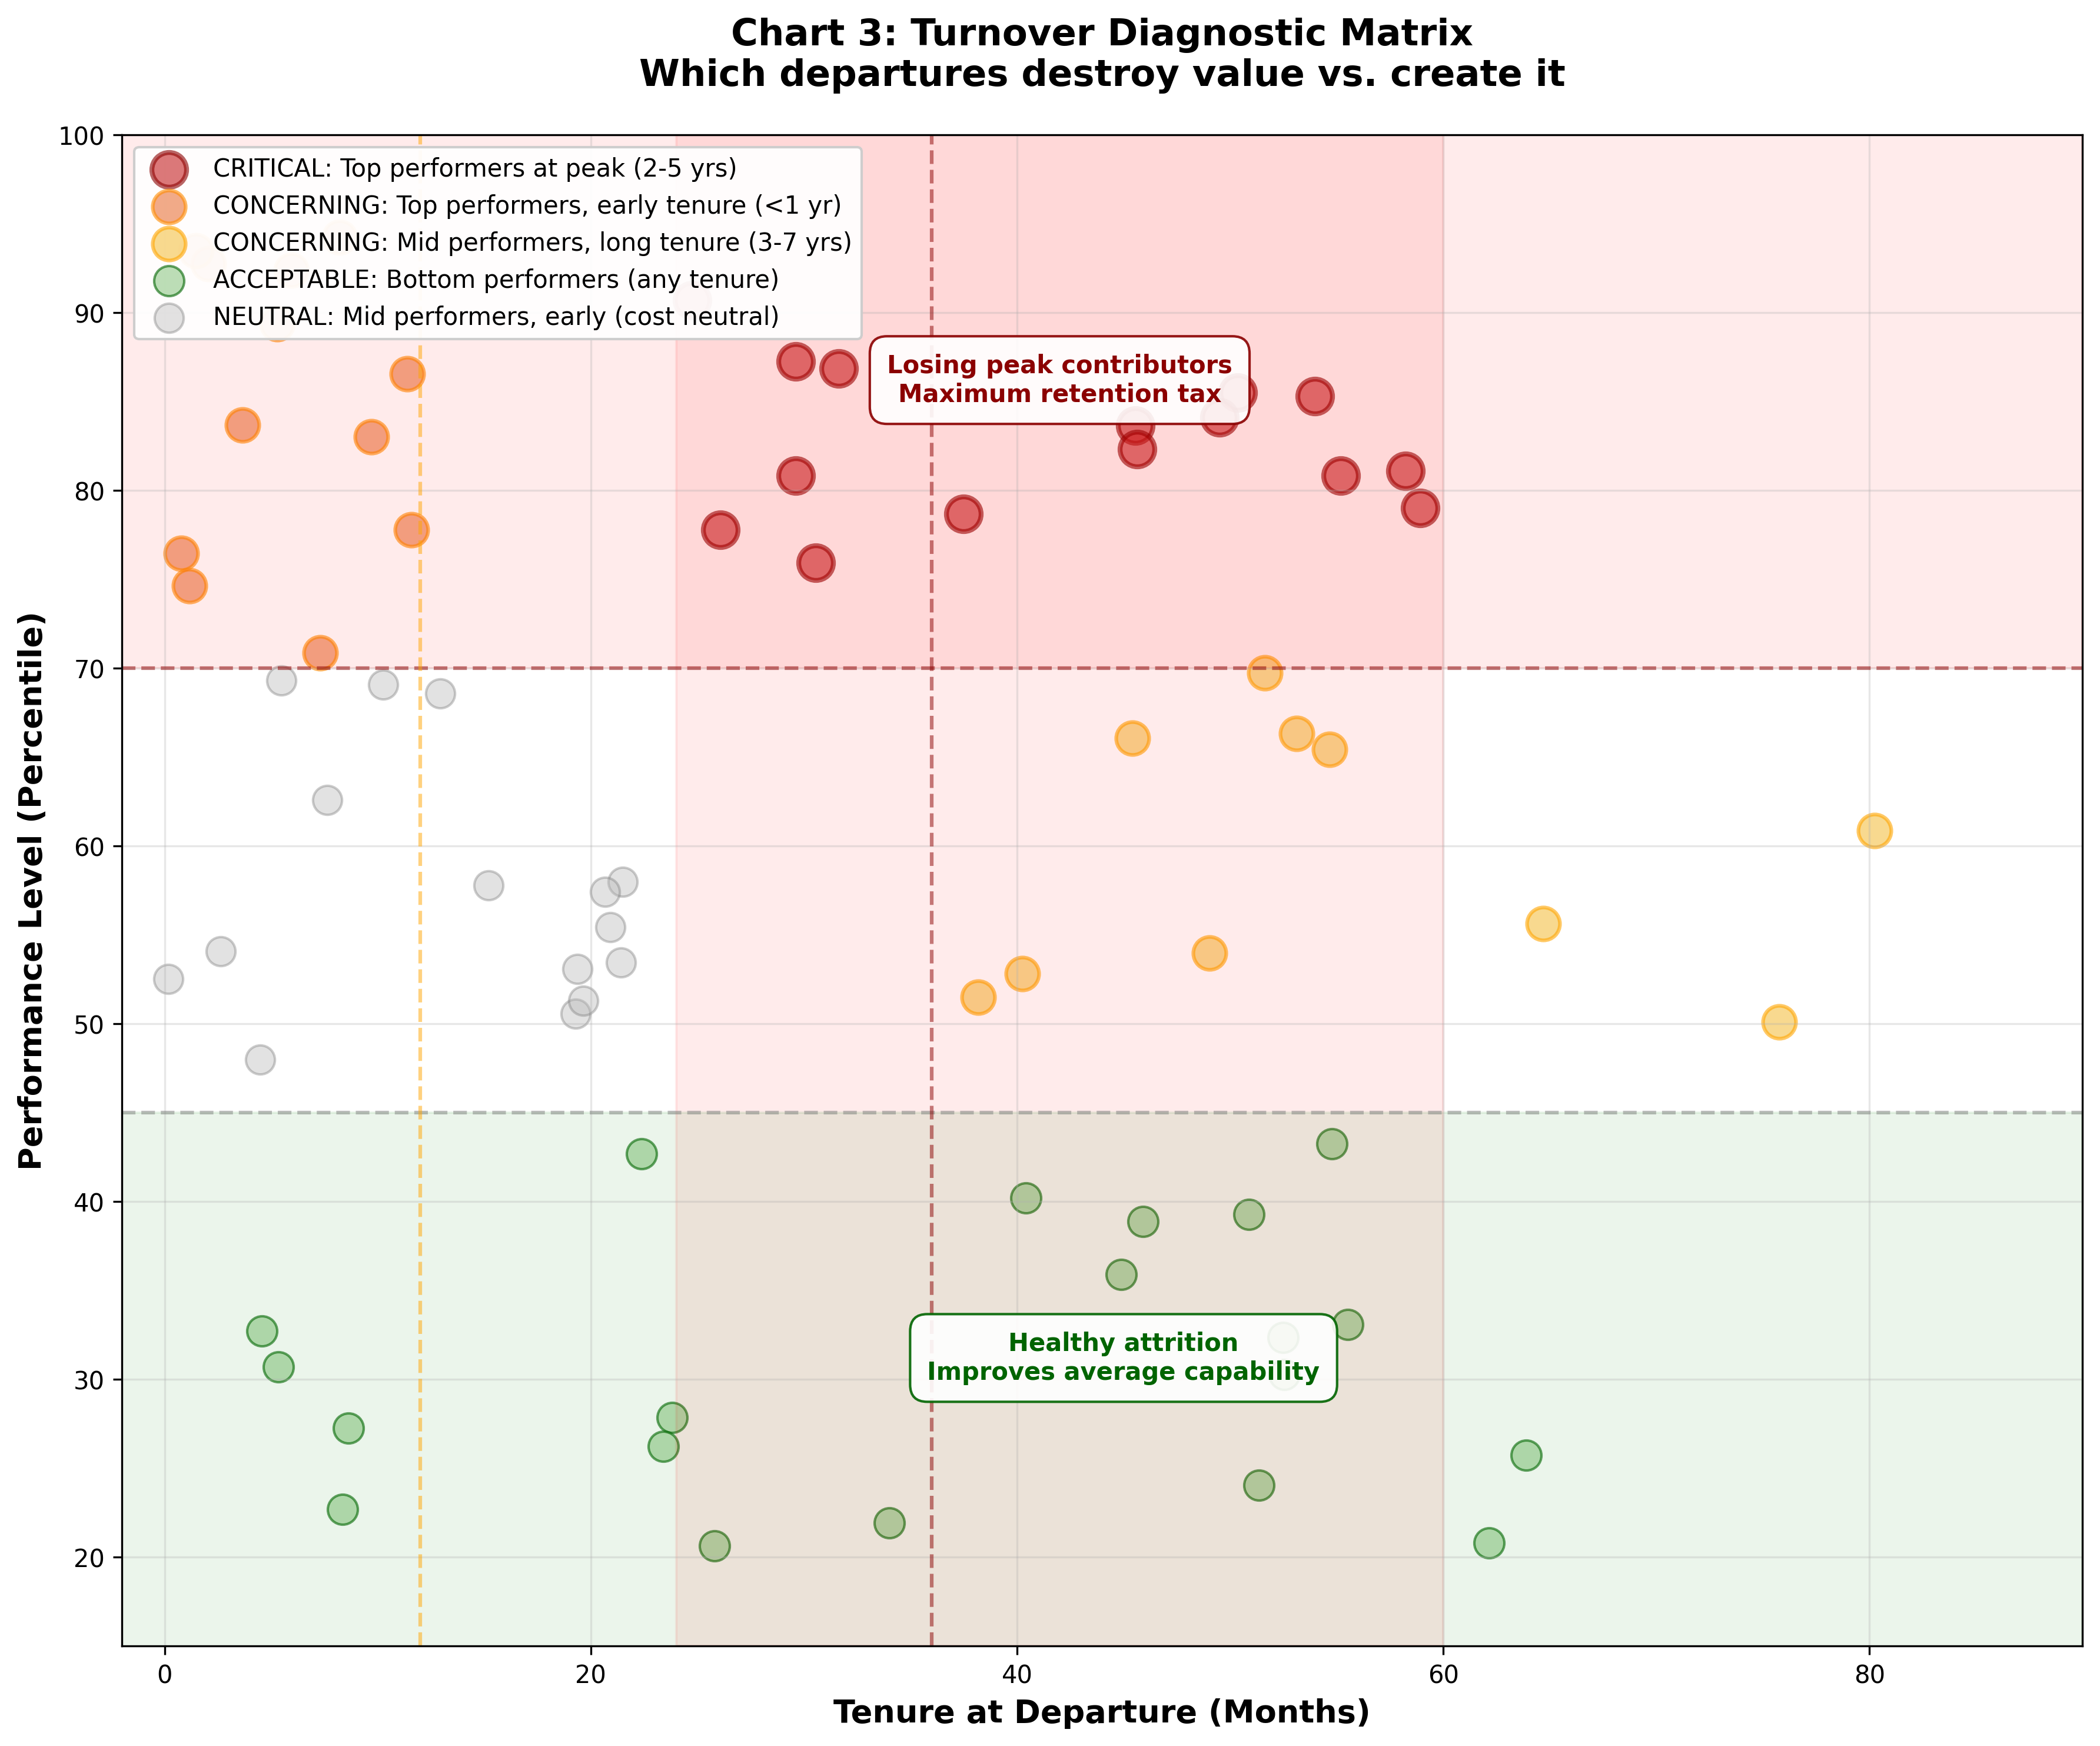
- Voluntary vs. involuntary (you want some involuntary turnover to clear underperformers)
- By tenure (losing people in their first year wastes all ramp investment; losing people at 3-5 years loses peak productivity)
- By performance level (losing bottom quartile is fine; losing top quartile is catastrophic)
- By role criticality (10% turnover in admin roles is different from 10% in senior engineering)
A company with 15% overall turnover that’s losing mostly bottom performers in their first 18 months has a manageable problem. A company with 15% turnover that’s losing top performers at 3-5 years of tenure has a crisis.
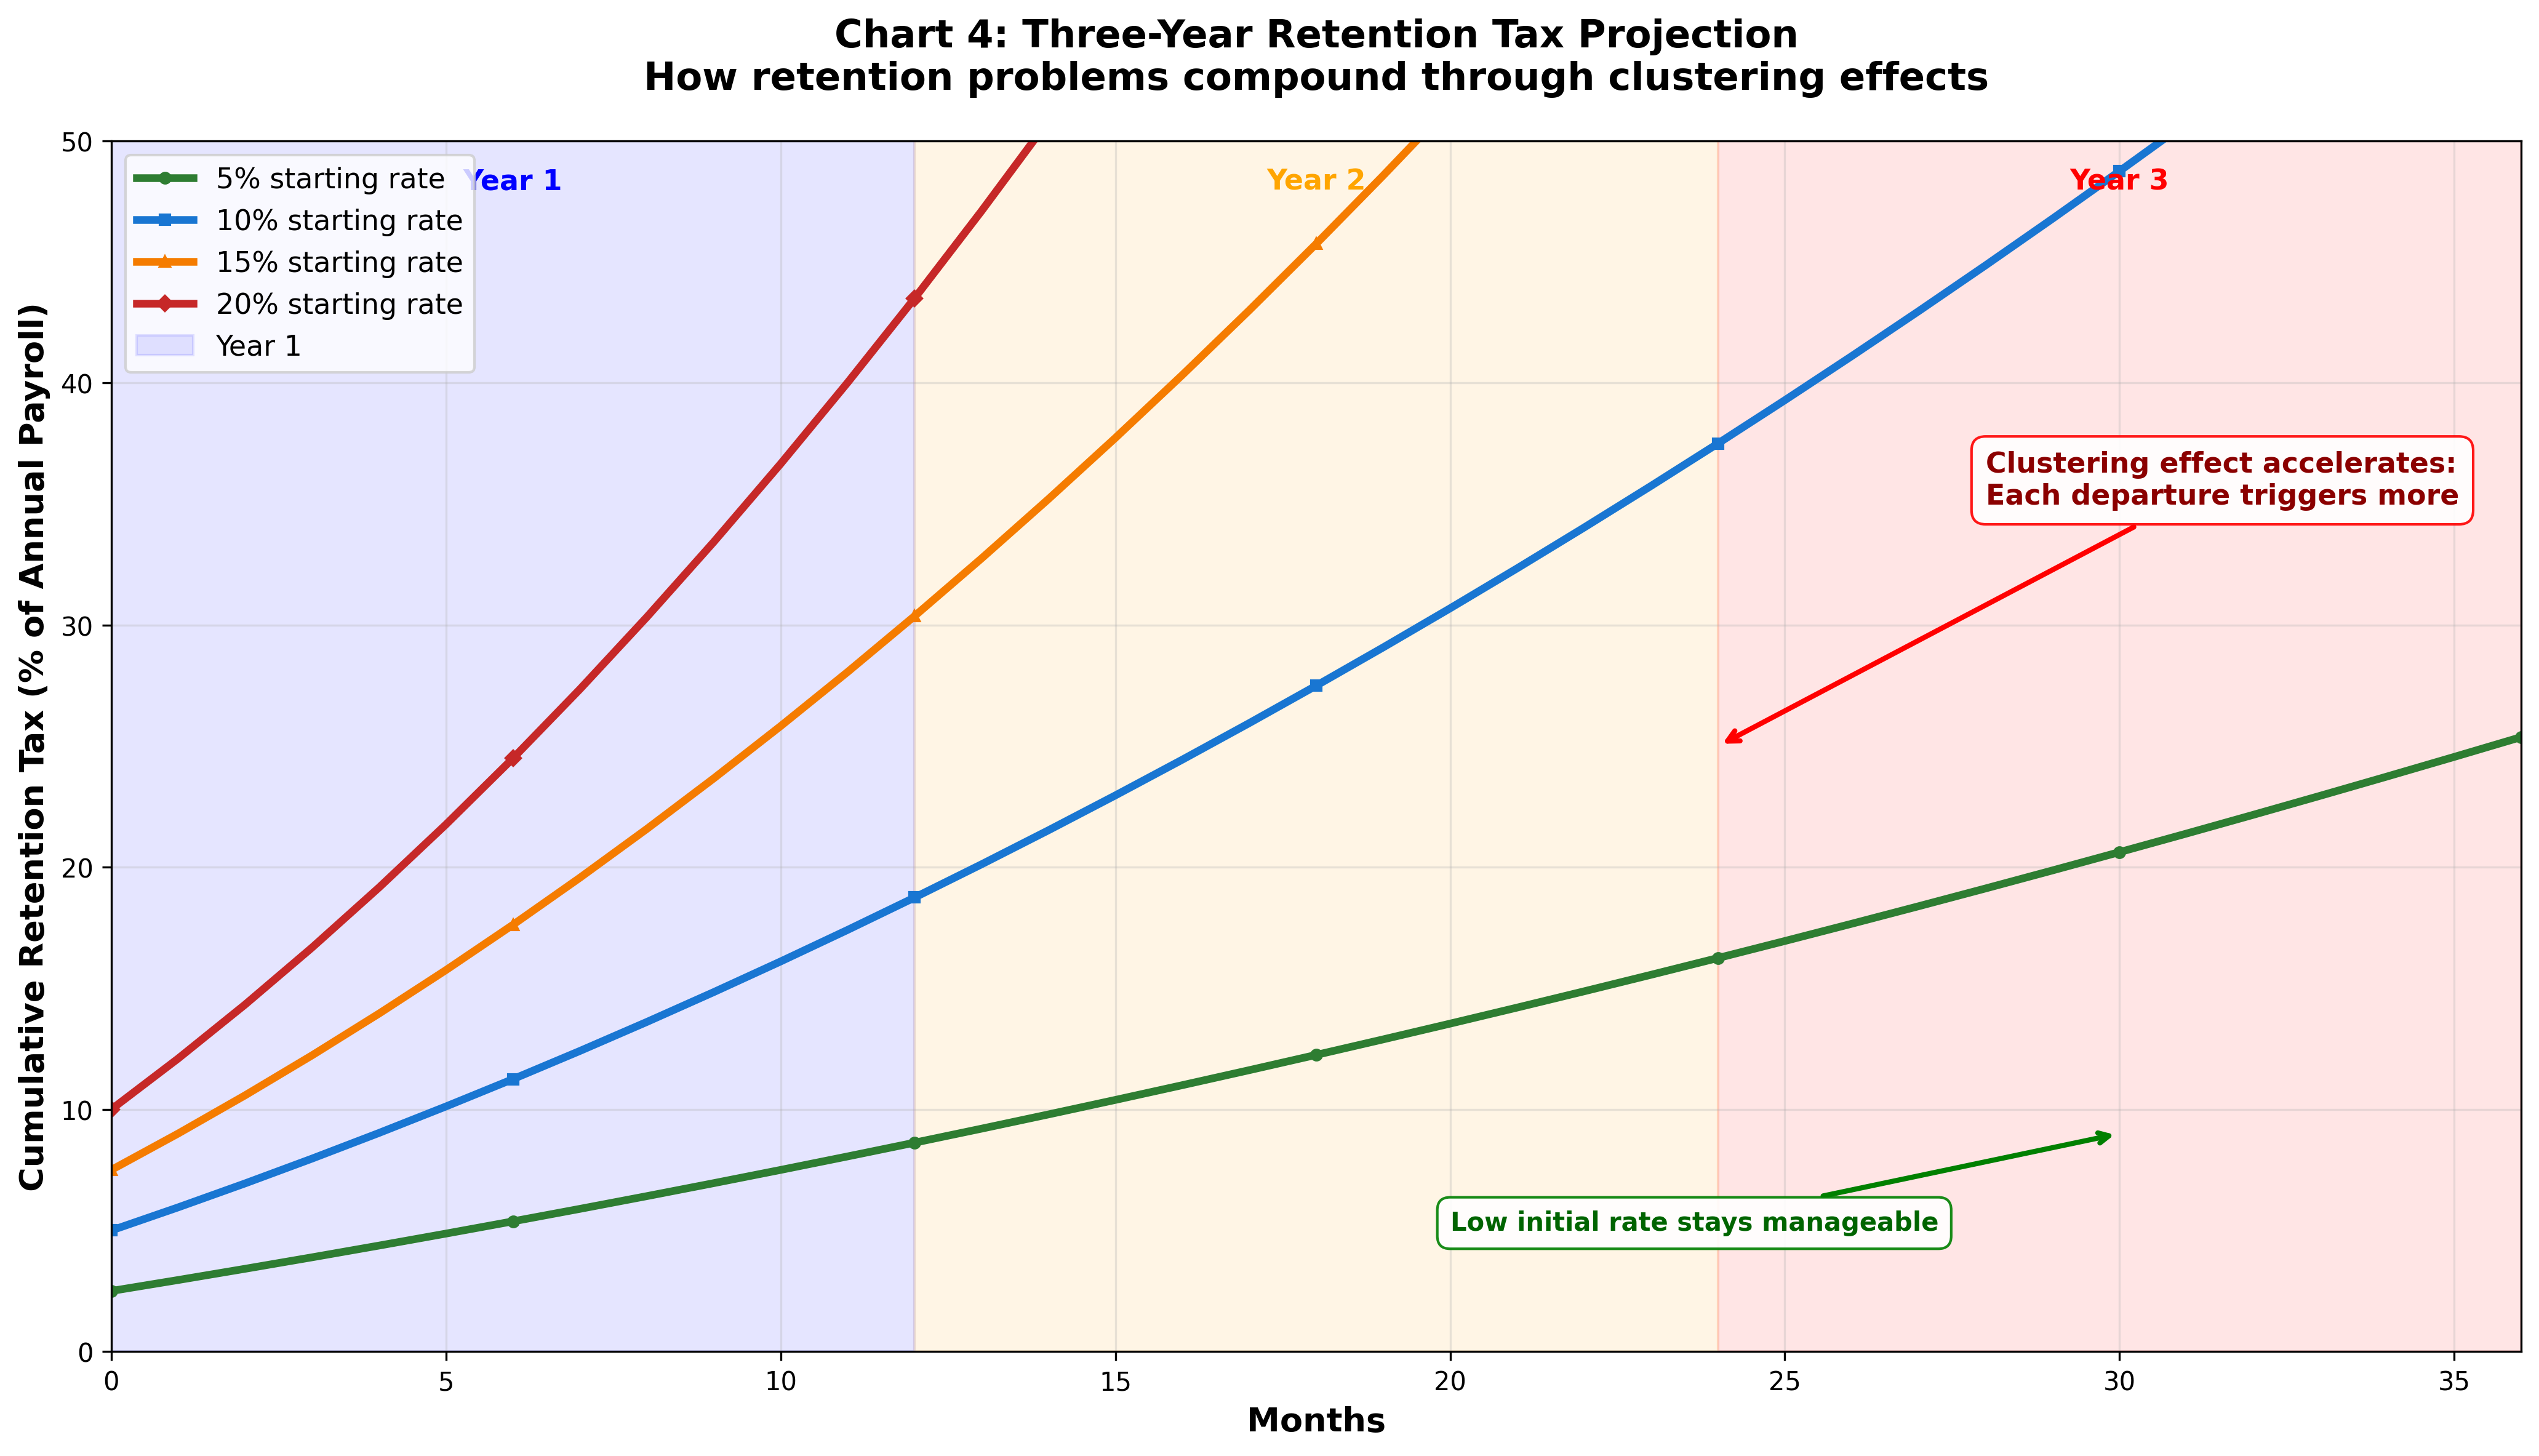
Step 4: Project the three-year impact
Retention problems compound. Each departure makes the next one more likely through increased workload, decreased morale, and disrupted team dynamics.
Model what happens if your current rate continues:
- Year 1: Current retention tax
- Year 2: Current rate + clustering effect (add 20-40% to turnover rate)
- Year 3: Year 2 rate + further clustering + quality degradation from rushed replacements
A 15% turnover rate that feels manageable today becomes 21% by year three, and the productivity impact isn’t linear—it accelerates as knowledge loss accumulates and team stability erodes.
What good retention actually costs
The natural question: If high turnover is so expensive, what does it cost to fix?
Less than you think—if you’re strategic about where you invest.
The research on retention interventions shows a clear pattern: you can’t buy your way out of a retention problem by throwing money at everyone. Across-the-board raises have minimal retention impact. Ping-pong tables and free snacks are rounding errors. What works is addressing the specific structural issues driving your departures.
The data consistently shows that 75% of voluntary turnover is preventable, and the top drivers are predictable:
- Poor management (cited by 57% of people who quit, according to DDI)
- Lack of career development (the number one reason per SHRM)
- Compensation significantly below market (note: “significantly”—small gaps don’t drive departures)
- Poor work-life balance and burnout
- Lack of recognition and feeling undervalued
Notice what’s absent from this list: insufficient perks, insufficiently cool office, insufficient team bonding activities.
Here’s what a targeted retention strategy actually looks like, using our 500-person company running $5 million in annual retention tax:
Invest in management capability ($250,000/year):
- Manager training focused specifically on retention behaviors (1-on-1s, feedback, development conversations, recognition)
- Manager coaching for identified high-risk teams
- Skip-level conversations to identify management problems early
Expected impact: 20-30% reduction in voluntary turnover (managers drive 70% of engagement variance)
Build systematic career development ($180,000/year):
- Clear career frameworks showing progression paths
- Structured mentorship program
- Internal mobility process that doesn’t require people to threaten to leave
Expected impact: 15-25% reduction in voluntary turnover (development opportunities are the #1 retention driver)
Fix compensation gaps strategically ($400,000/year):
- Market analysis to identify where you’re genuinely underpaying
- Targeted adjustments for flight-risk roles and high performers
- Transparent compensation bands
Expected impact: 10-15% reduction in voluntary turnover among adjusted population
Total investment: $830,000
Expected retention improvement: 25-35% reduction in voluntary turnover rate
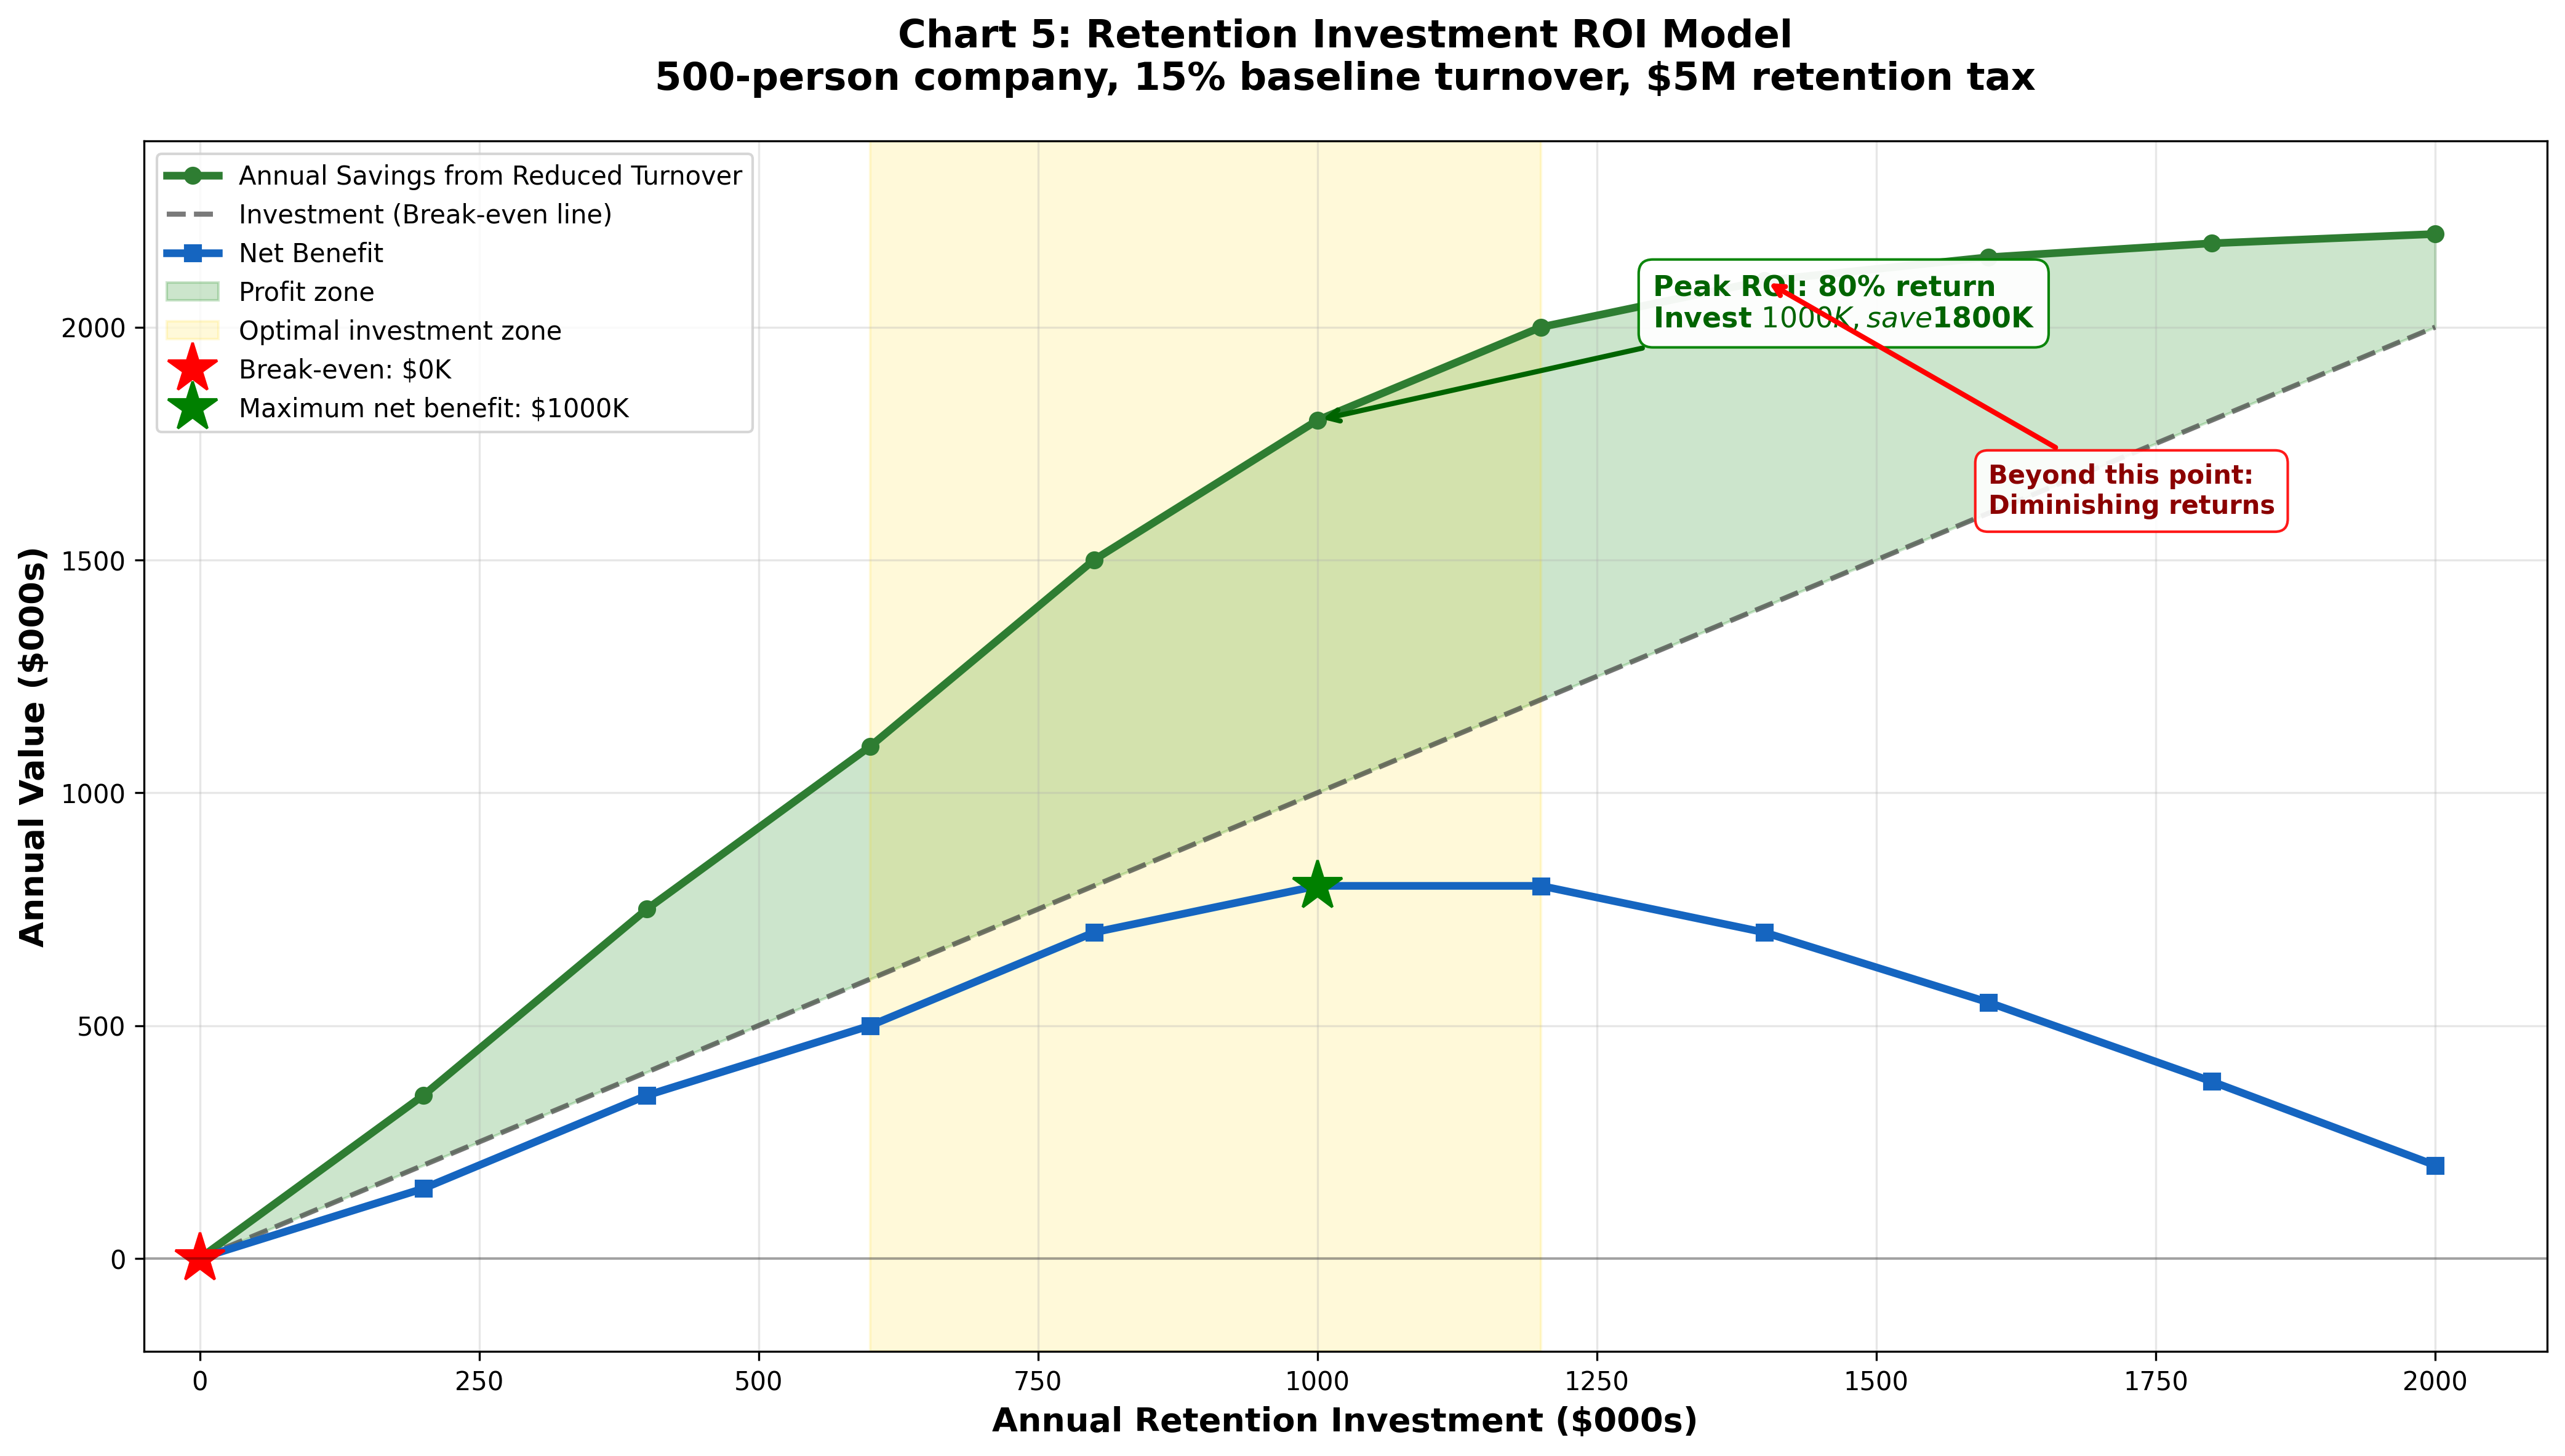
For our 500-person company running 15% turnover with $5 million retention tax:
- 30% reduction in turnover = 4.5% fewer departures
- 4.5% fewer departures = ~22 positions retained
- 22 positions × true cost per departure = $1.5-1.8 million saved
ROI: Invest $830,000 to save $1.5-1.8 million = 80-115% return in year one
And this understates the impact because it doesn’t account for:
- Reduced clustering effects (keeping people prevents their departures from triggering others)
- Preserved institutional knowledge
- Maintained team productivity and morale
- Improved quality from not rushing replacements
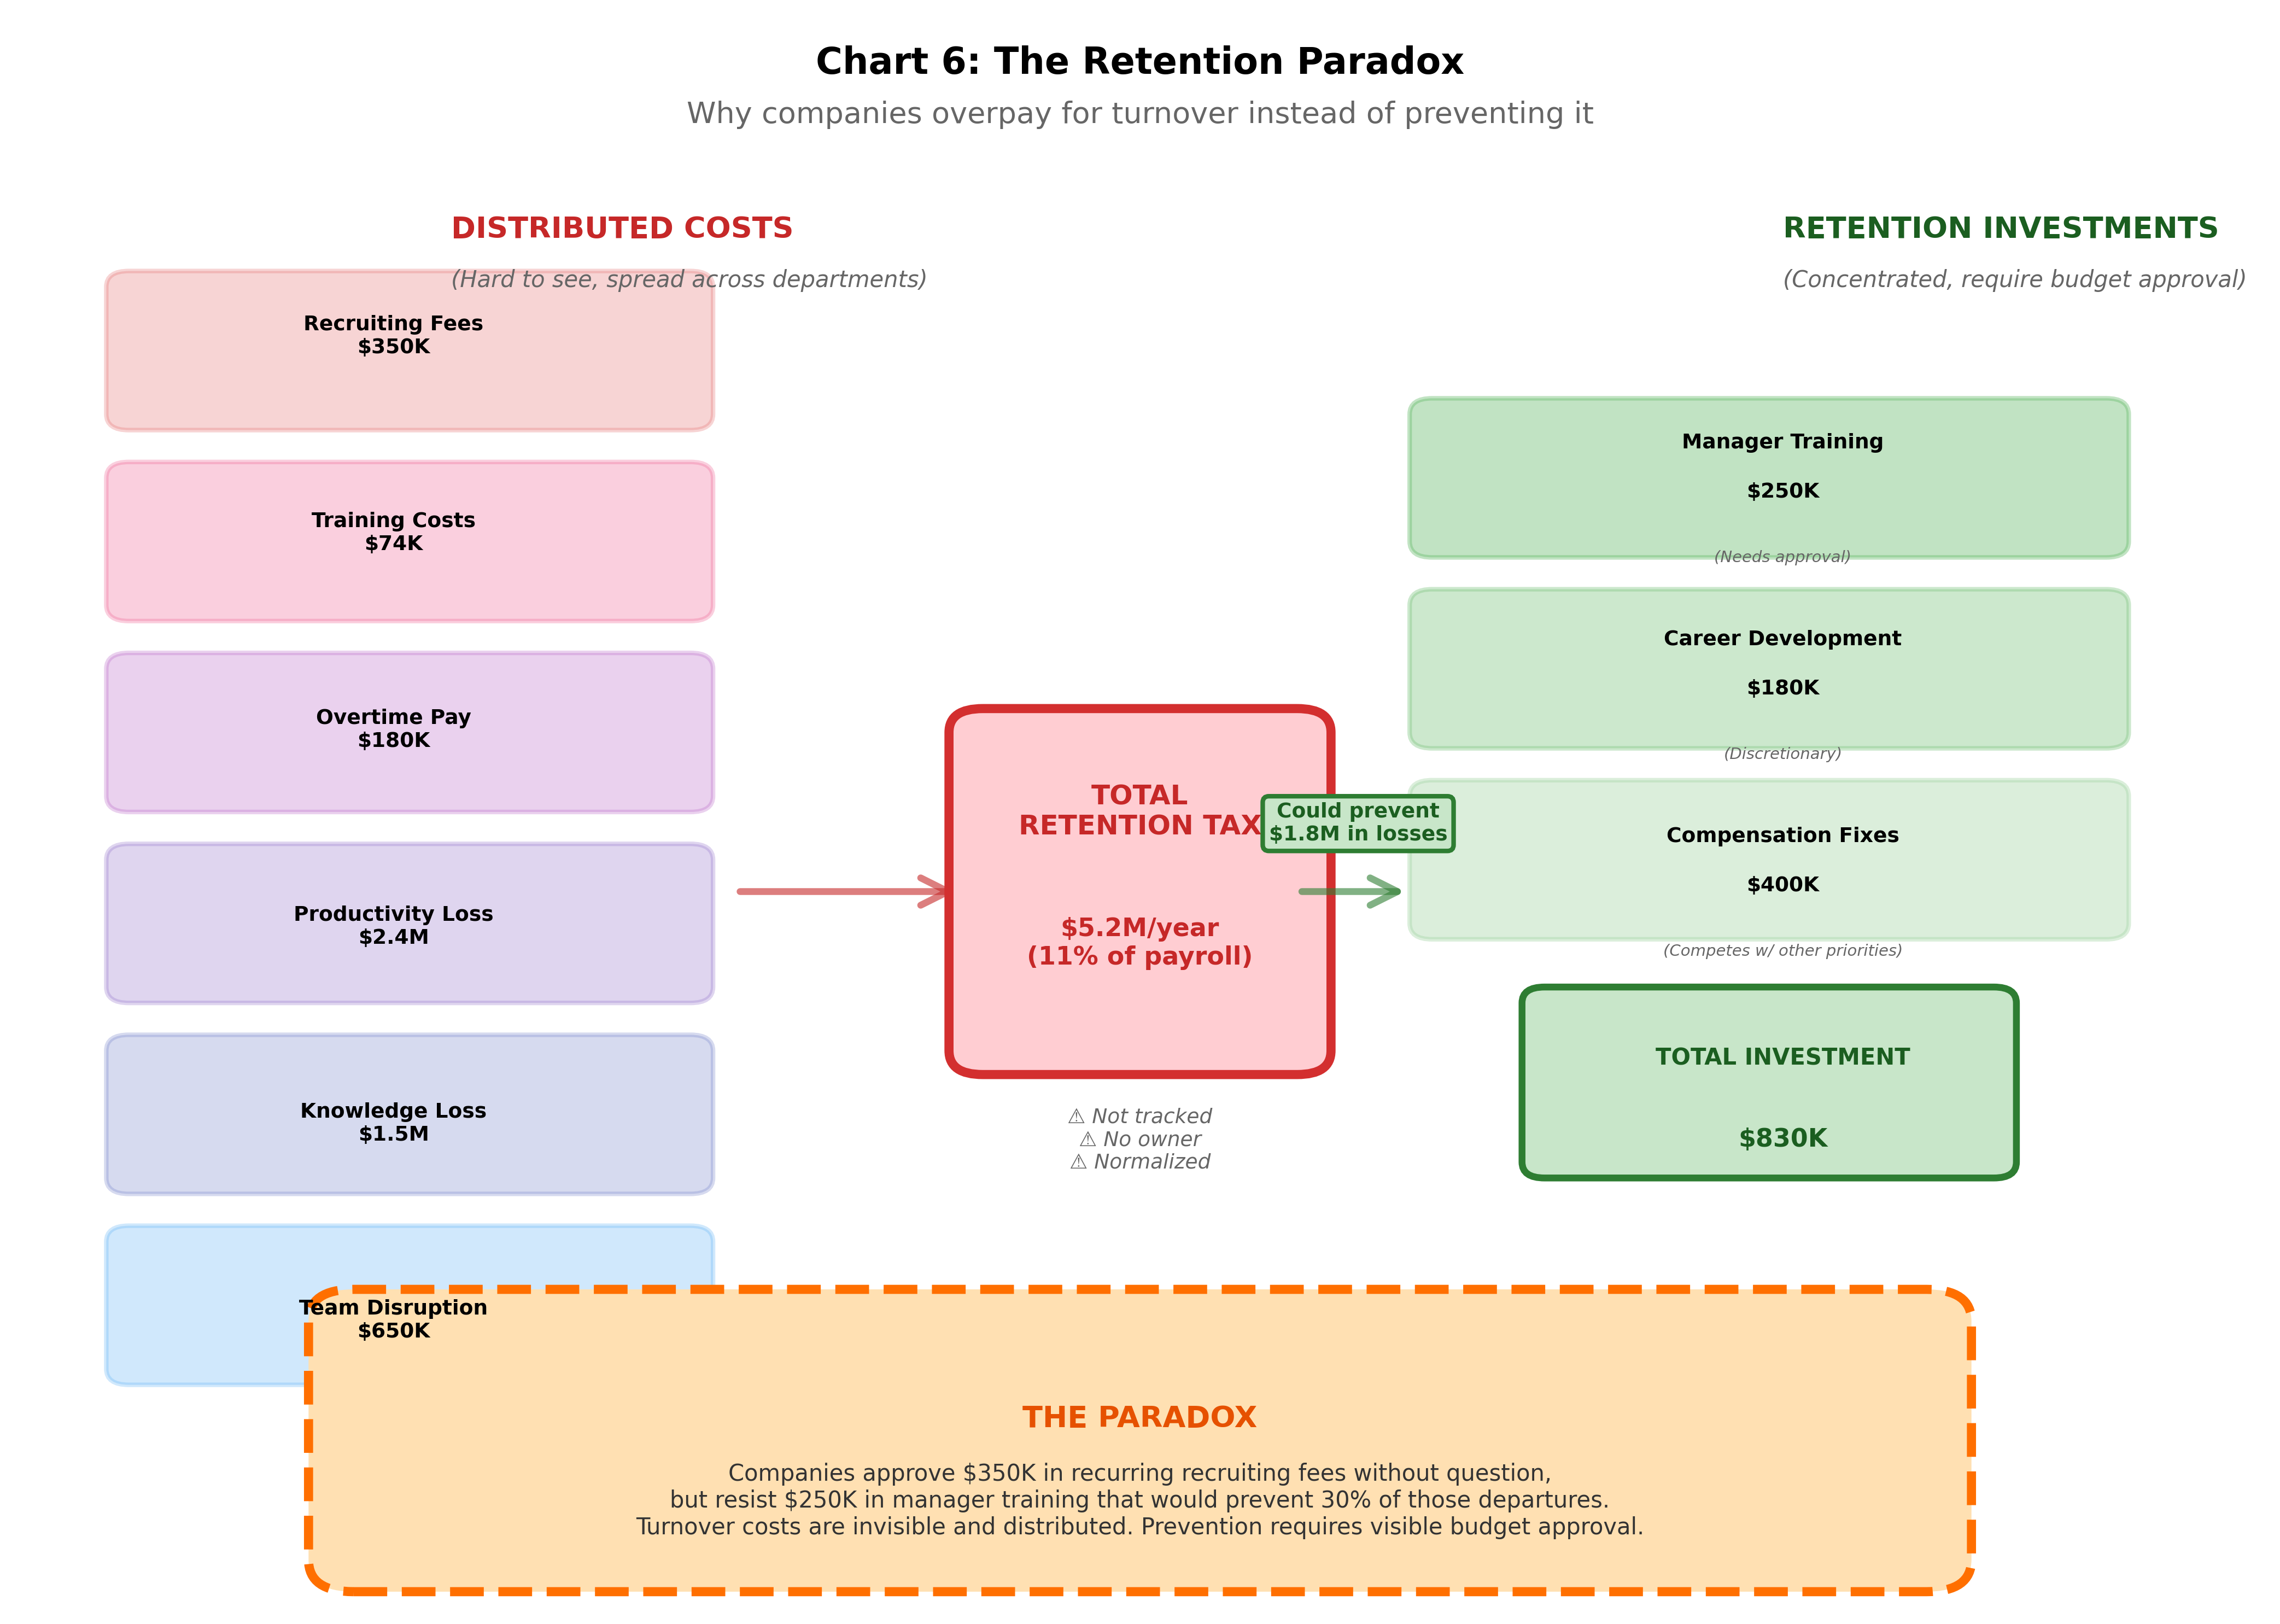
The retention paradox: Why companies keep overpaying
If the math is this clear, why do so many companies accept punishing turnover rates?
Because the costs are distributed and the benefits of retention are hard to attribute.
When you lose someone, recruiting writes the check. HR coordinates the replacement. The hiring manager absorbs the productivity hit on their team. Finance sees the overtime charges. The team experiences the quality degradation. Nobody owns the aggregate impact, so nobody feels accountable for fixing it.
Contrast this with how companies think about customer acquisition cost (CAC) and lifetime value (LTV). Every B2B company knows these metrics, obsesses over the ratio, and adjusts strategy when CAC climbs too high or LTV drops. The CEO reviews these numbers monthly.
But employee acquisition cost and employee lifetime value? Most companies couldn’t tell you these numbers if asked. They know what recruiting costs, but they don’t know what a departed employee actually cost once you factor in ramp time and knowledge loss. They don’t track the revenue impact of losing a top performer at peak productivity.
This creates a structural bias toward accepting turnover rather than investing in retention. Recruiting costs are visible and approved annually. Management training is discretionary. Turnover shows up as normal operating expenses across multiple departments. Retention initiatives require arguing for new budget.
The incentive structure is backwards. Companies will approve $250,000 in recruiting fees to replace 50 departures without hesitation, but resist spending $150,000 on manager training that would prevent 20 of those departures in the first place.
There’s also a subtle cultural factor at play. High turnover becomes normalized. When 15-20% of your company turns over annually, the constant recruiting, onboarding, and backfilling just becomes “how we operate.” Teams adapt. Managers get used to always having open positions. The elevated retention tax gets built into the baseline.
And because everyone’s benchmarking against industry peers who have the same problem, these rates feel acceptable. When the compensation survey shows your turnover is “in line with industry average,” leadership relaxes. Nobody asks whether the industry average is sustainable or optimal.
When to accept higher turnover
Not all turnover is worth preventing. Some attrition actively improves your organization.
You should tolerate, even encourage, turnover when:
Performance-based attrition improves average capability. If your bottom 10% self-selects out annually, don’t fight it. The retention tax on low performers is worth paying to avoid the harder conversation of managing them out. As long as you’re replacing them with lateral or better hires, the churn is value-creating.
Role commoditization reduces replacement costs. For positions where ramp time is 30-60 days and the work is largely procedural, replacement costs are lower and the retention math changes. You might accept 20-25% turnover in customer service roles if the economics work—recruiting and training 25 people annually could cost less than the retention interventions required to cut that rate in half.
Growth creates natural mobility. Fast-growing companies (30%+ annual headcount growth) create internal opportunities that feel like retention to the company but look like turnover in the data. Someone leaving the sales team to join a new business unit shows up in departmental turnover but isn’t really a retention problem. This kind of churn is healthy and unavoidable.
Market dynamics prevent retention. Some roles face structural market pressures you can’t overcome. Software engineers in certain specializations have 25-30% annual turnover rates because the market demand is so aggressive. You can push that to 18-20% with excellent management and development, but you’re never getting to 8%. Accept the reality and optimize for quick onboarding and knowledge transfer instead of fighting the inevitable.
The key is being intentional about where you accept turnover and where you fight it. Most companies have uniform retention strategies—the same programs, same manager training, same career frameworks for everyone. Smart companies segment their workforce and apply different retention approaches based on role criticality, replacement difficulty, and strategic value.
For your top 20% of critical roles (the ones where institutional knowledge matters most, replacement is hardest, and productivity impact is greatest) you should be running close to 5% turnover. Invest heavily in retention for this population. Pay above market. Give them development resources and career paths. Shield them from nonsense.
For your middle 60% of roles (important but not irreplaceable) target 10-12% turnover. Provide good management, reasonable development, market-rate compensation. Accept that some people will leave and make peace with it.
For your bottom 20% of roles (easiest to replace, shortest ramp times) you might tolerate 15-20% turnover if the economics work. Don’t neglect these people, but don’t overspend on retention either.
This segmentation approach lets you optimize your retention budget, investing heavily where it matters most and accepting higher natural churn where replacement is manageable.
The retention decision framework
So here’s how to think about your retention tax:
If your turnover rate is under 8%: You’re probably in good shape. Make sure you’re not accidentally creating stagnation—check if internal mobility is healthy and you’re clearing out bottom performers. But generally, stay the course.
If your turnover rate is 8-15%: Diagnostic territory. Break down your turnover by performance level, tenure, and role criticality. If you’re losing mostly bottom performers in their first 18 months, you likely have a hiring problem more than a retention problem. If you’re losing top performers at 3-5 years, you have a management and development problem. If turnover is evenly distributed, you probably have a compensation or culture issue.
If your turnover rate is 15-25%: You’re almost certainly paying a retention tax that exceeds what it would cost to fix the underlying problems. Model your true cost per departure, calculate your retention tax as percentage of payroll, and build a business case for systematic retention investment. The ROI is probably 80-150%.
If your turnover rate exceeds 25%: Crisis mode unless you’re in an industry where this is structurally unavoidable (retail, hospitality, seasonal work). Your retention tax is probably consuming 12-18% of payroll. You’re likely experiencing clustering effects where turnover triggers more turnover. Leadership needs to treat this as an existential issue, not an HR problem.
The bottom line: your turnover rate isn’t a fact of nature. It’s a choice—either active or passive. Most companies make it passively, inheriting industry norms and never questioning whether those norms make economic sense for their specific business model.
But when you actually run the numbers, the retention tax is almost always bigger than you think. That “normal” 15% turnover rate? It’s costing you 30-40% of your productive capacity and 10-12% of your payroll. You’re employing 500 people but only getting output from 350.
The solution isn’t to throw money at everyone or implement a dozen new retention programs. It’s to get clear on where turnover hurts most, calculate what it’s actually costing, and make targeted investments in the specific structural issues driving your most damaging departures.
Because you’re already paying for retention—through recruiting fees, training costs, productivity loss, and degraded team performance. The only question is whether you’re getting a return on that spending.
Most companies aren’t. They’re paying the retention tax every year without realizing it’s a tax they chose.
What a weird and wonderful world,