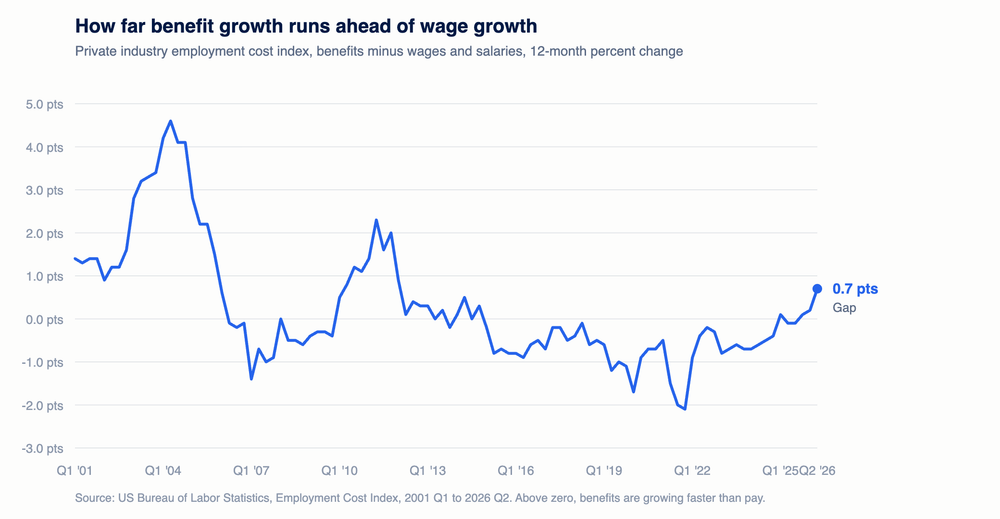
In the second quarter of 2004, benefit costs for American employers grew 7.3% over the year. Wages grew 2.6%. The gap between them was 4.6 percentage points, the widest in the twenty-five years of this series, and it stayed open for five straight years.
Nobody now remembers 2004 as a wage boom, because it was not one. It was a health insurance boom, and it ran through payroll.
The reason for starting there is that the same gap has just reopened. It is small so far, 0.7 points in the second quarter of 2026, but it is the widest since the first quarter of 2012 and it has widened three quarters in a row.
The rate, and then the level
There are two BLS releases about compensation and most reporting uses only the first.
The Employment Cost Index gives you the rate of change. It fixes the mix of jobs and industries and asks what it costs to employ the same people doing the same work as a year ago. That fixed mix is what makes it useful. Average hourly earnings, which arrives with the monthly jobs report and gets quoted far more often, does not do this. Lay off fifty warehouse staff, keep twenty engineers, and average hourly earnings rises. Nobody got a raise.
Employer Costs for Employee Compensation gives you the level. Not how fast the bill is growing, but what the bill actually is, in dollars an hour, split into its parts.
Neither release is enough on its own. The rate tells you something is moving and cannot tell you what. The level tells you what the money is and cannot tell you whether it is unusual. This edition uses both, and they point at the same thing.
What the rate says
In the twelve months to June, private sector wages and salaries rose 3.1%. Benefits rose 3.8%. Total compensation rose 3.3%, which is the number that lands in a budget.
Wages peaked at 5.7% growth in the second quarter of 2022 and have fallen almost without interruption since. That is the disinflation story and it has been told at length.
Benefits fell too, bottomed at 3.3% in the second half of 2024, and then turned around. They have risen in three of the last five quarters, including the last two, and now sit at 3.8%.
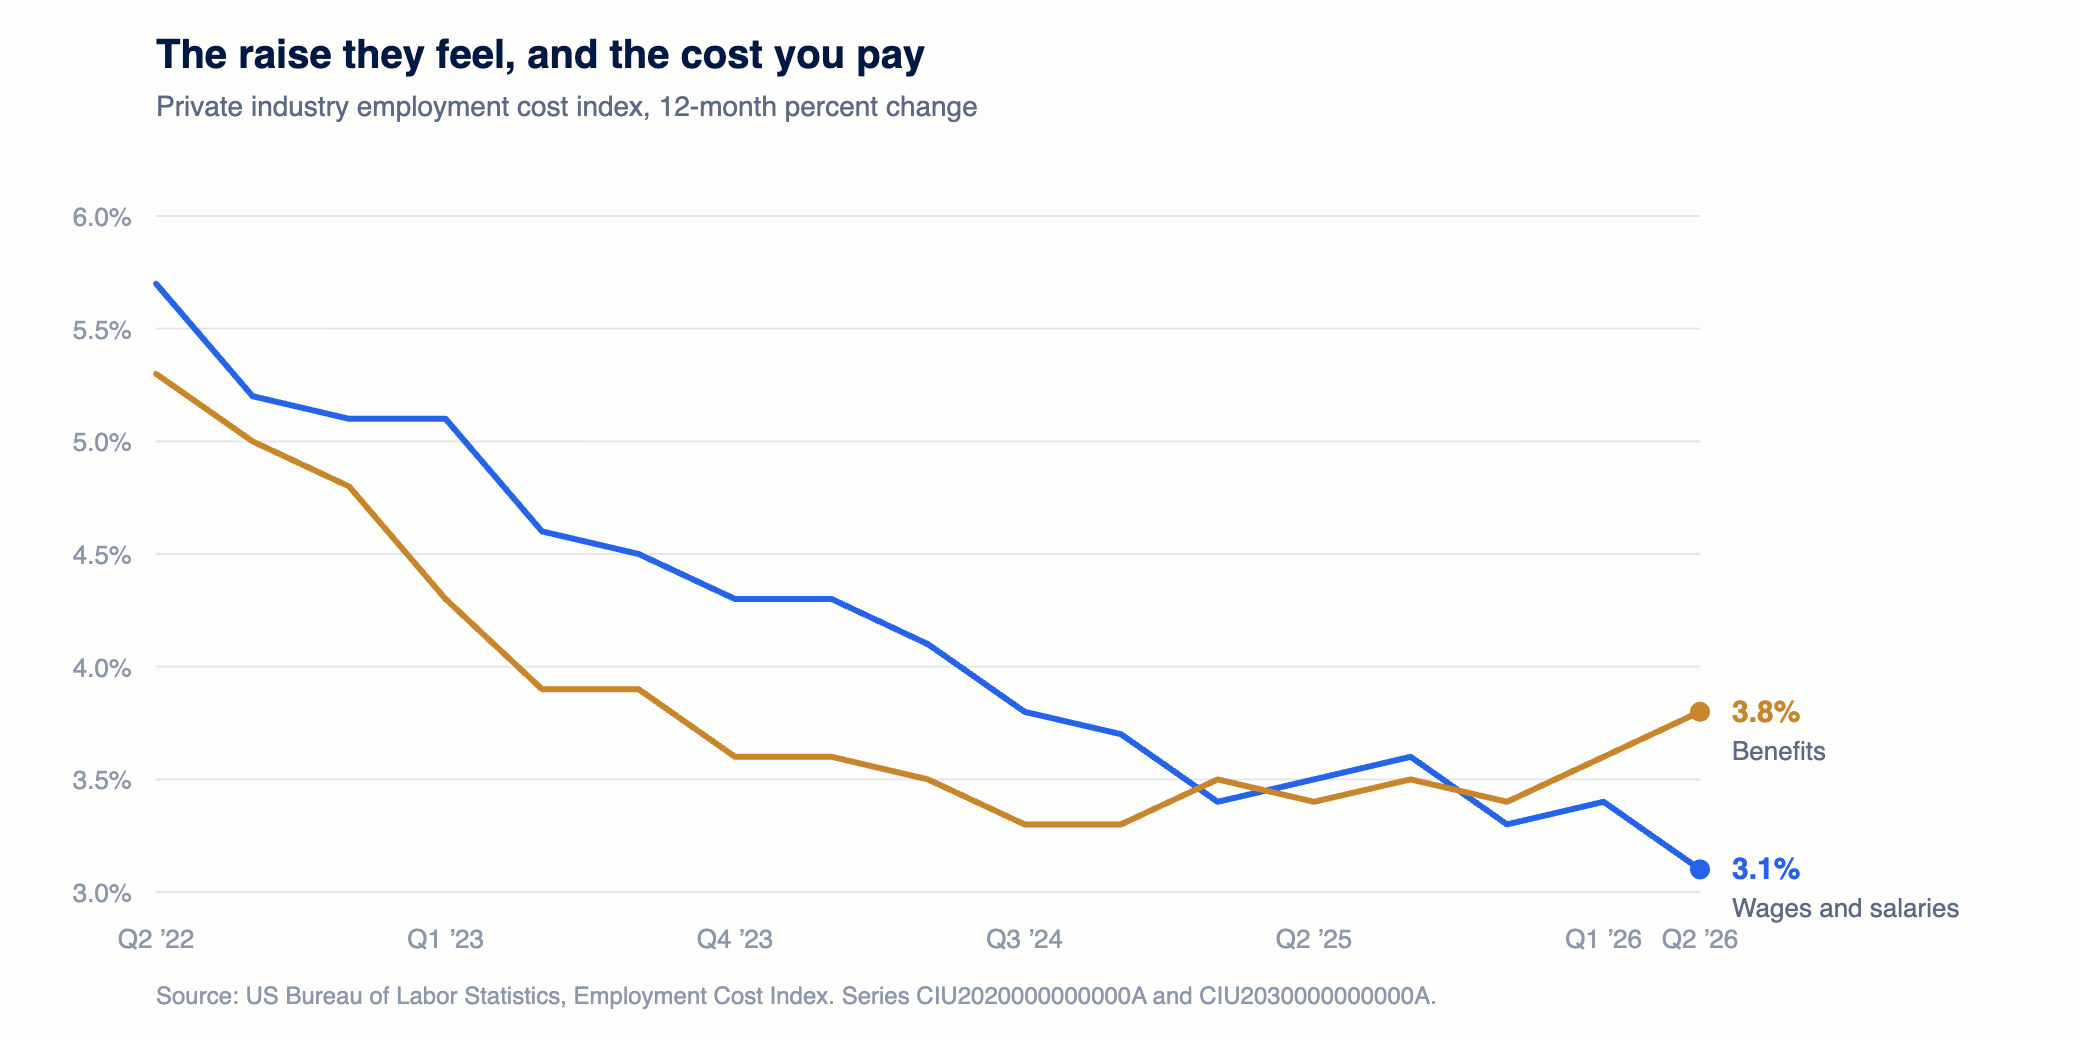
The two lines first crossed in the first quarter of 2025, traded places through the middle of that year, and have been apart in the same direction since the fourth quarter. The gap has widened for three straight quarters.
How unusual this is, which is less than it looks
It would be easy to write that a 0.7 point gap is remarkable. Over a long enough window it is not, and the long window is the more useful thing to look at.
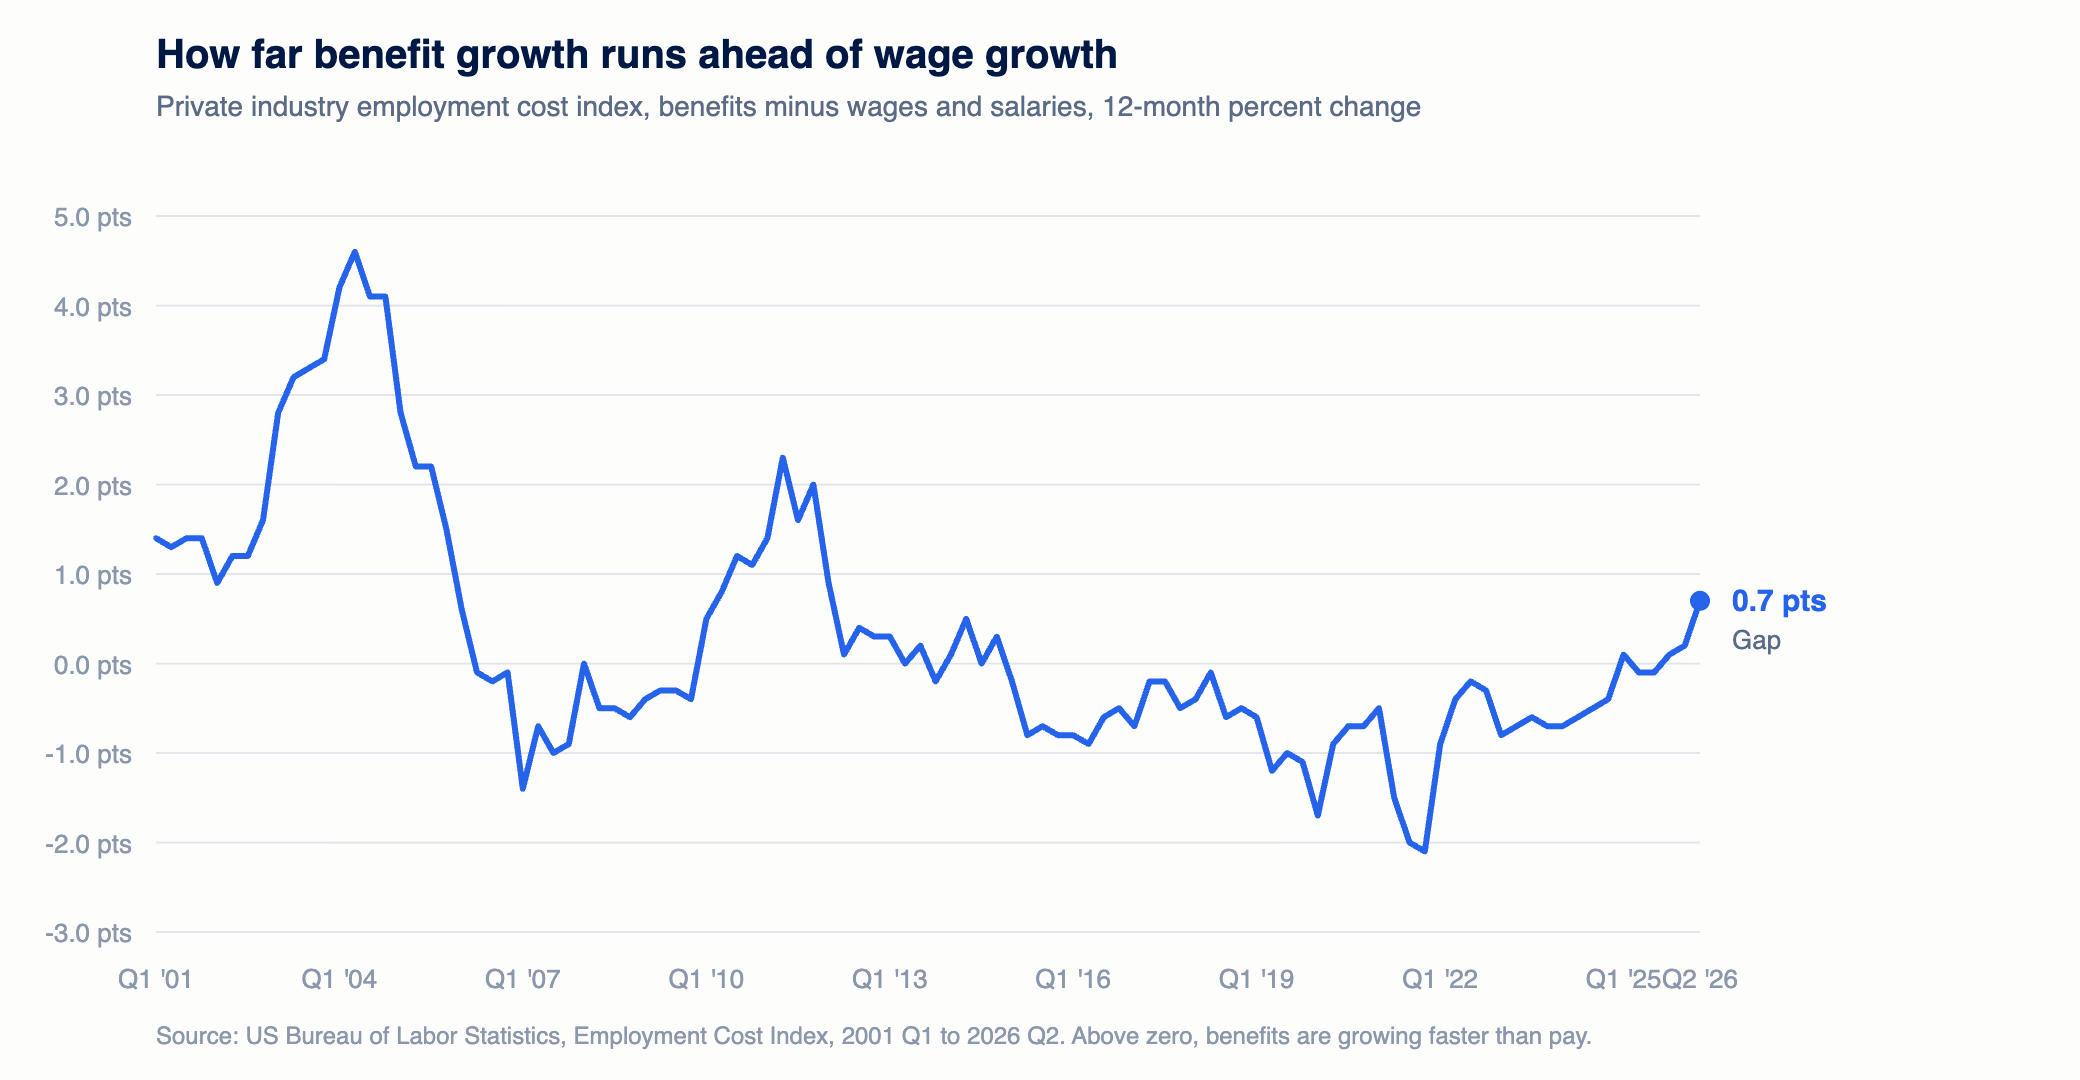
Benefits have grown faster than wages in 42 of the last 102 quarters. The dominant episode runs from the first quarter of 2001 to the first quarter of 2006: twenty-one consecutive quarters, peaking at that 4.6 point gap, during the period when health premiums were rising at double digits and employers were absorbing it.
A second, smaller episode ran from 2010 to 2013 and peaked at 2.3 points.
Then the pattern inverted. Through the hiring boom of 2021 and 2022 wages ran as much as 2.1 points ahead of benefits, which is the mirror image and the widest gap in the series in that direction. When labor is scarce, employers compete on the number the candidate can see.
Against that history, 0.7 points is early innings. What makes it worth attention is not the size but the direction and the persistence: three quarters of widening, off a trough, with the driver identifiable.