The layoff rate has been quoted in almost every piece written about the American labor market this year, and it has not told anyone anything since early 2022.
Here is the test. Over the past four and a half years the monthly layoff and discharge rate has moved with a standard deviation of 0.085 percentage points. Between 2001 and 2019 it moved with a standard deviation of 0.164. It is currently varying at roughly half its normal amount, around a level that has barely shifted.
A number that does not move cannot be evidence of anything. It has been treated as evidence of strength for three years.
What the series actually contains
JOLTS reports four things every month and they are not equally informative.
Job openings are a stock, and they measure intent. A posted job is not a job.
Hires and quits are flows, and they measure what happened. Somebody started, somebody left.
Layoffs and discharges are also a flow, and this is the one that has flatlined.
In June the layoff rate was 1.1%. It averaged 1.21% through 2019, which nobody described as a period of mass job destruction. It has not been above 1.2% or below 0.9% at any point since January 2022. Fifty-four months inside a band three tenths of a point wide, through a hiring boom, a tech correction, a rate cycle and a federal workforce reduction.
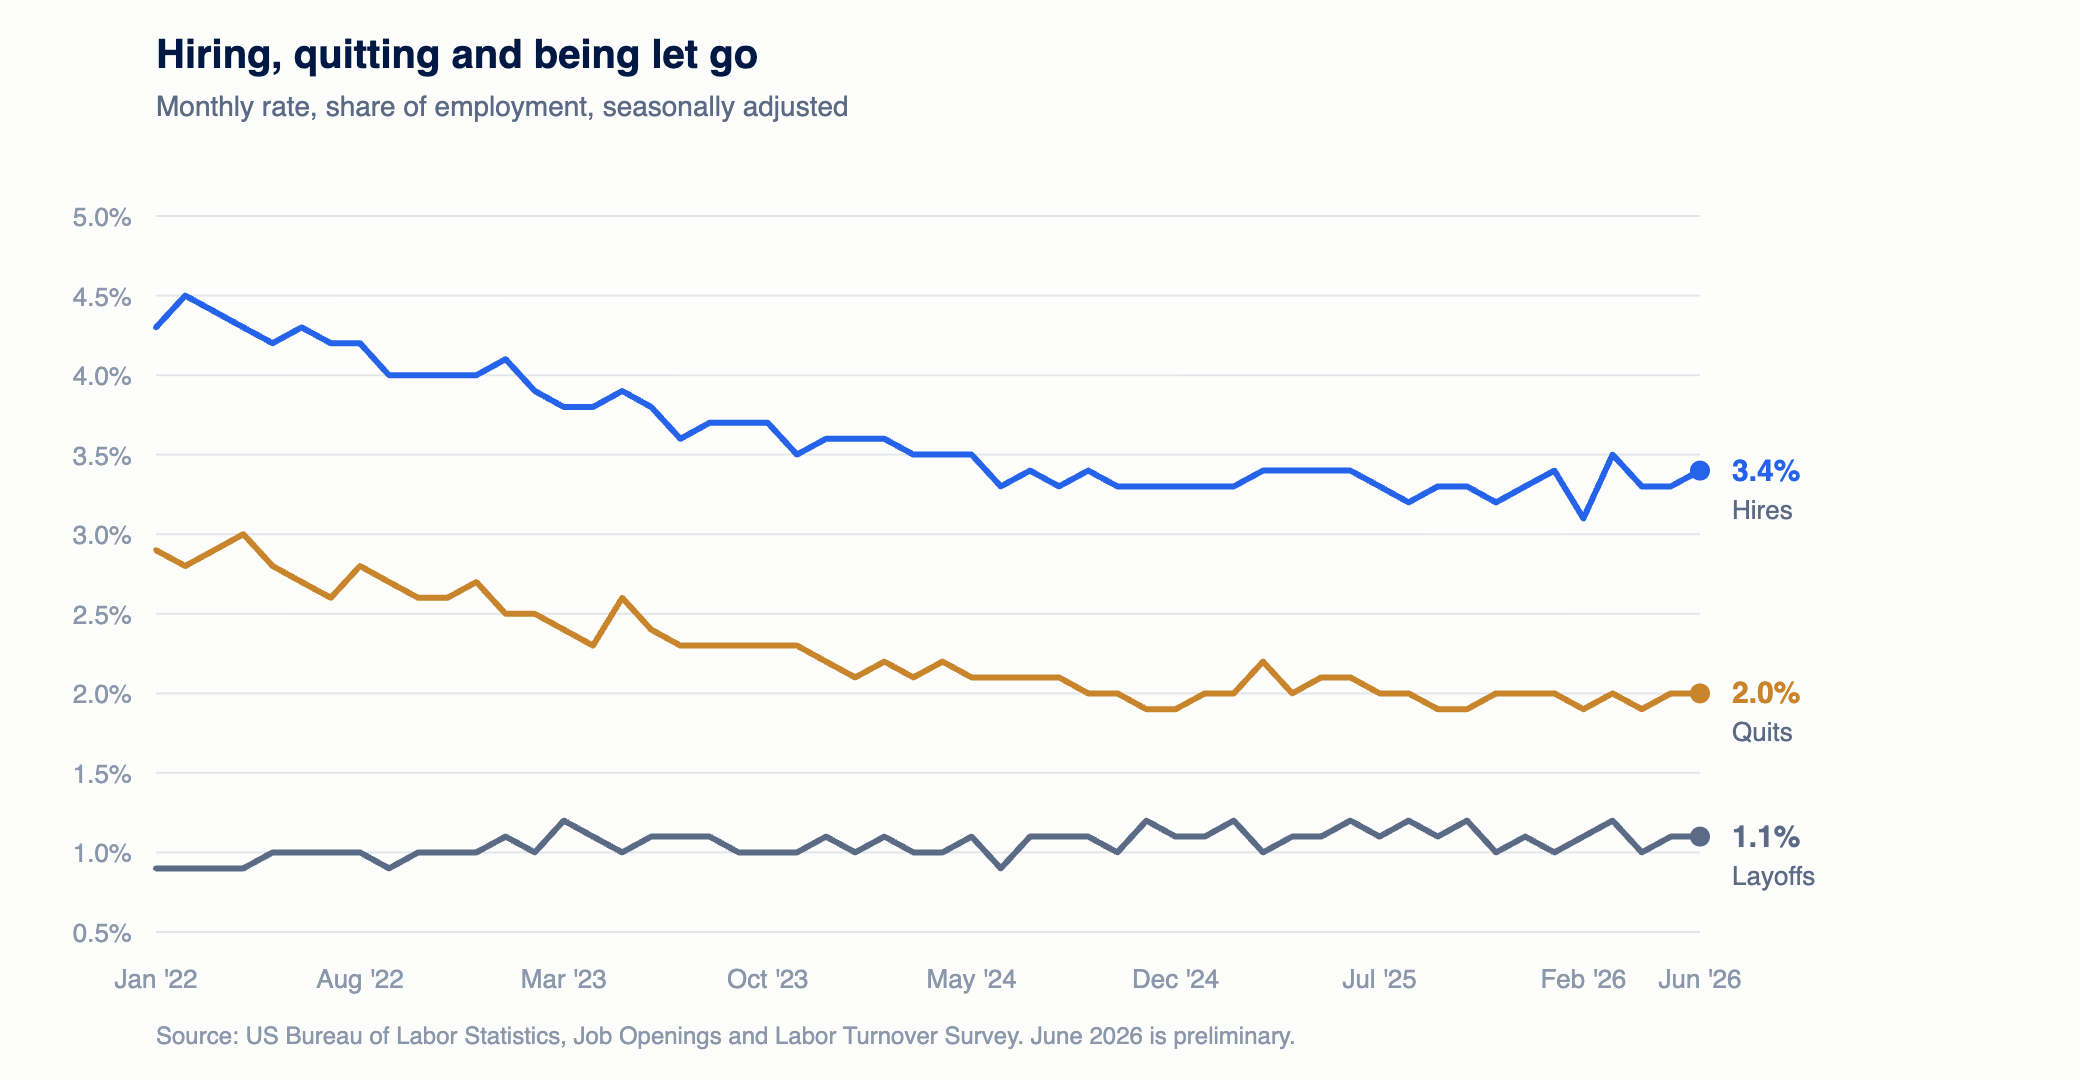
That is the bottom line on the chart, and its flatness is the finding rather than the background.
The number that does move
The quits rate is the share of employed people who leave voluntarily in a month. It is the closest thing this data has to a measure of confidence, because quitting is what people do when they believe there is something better to walk to.
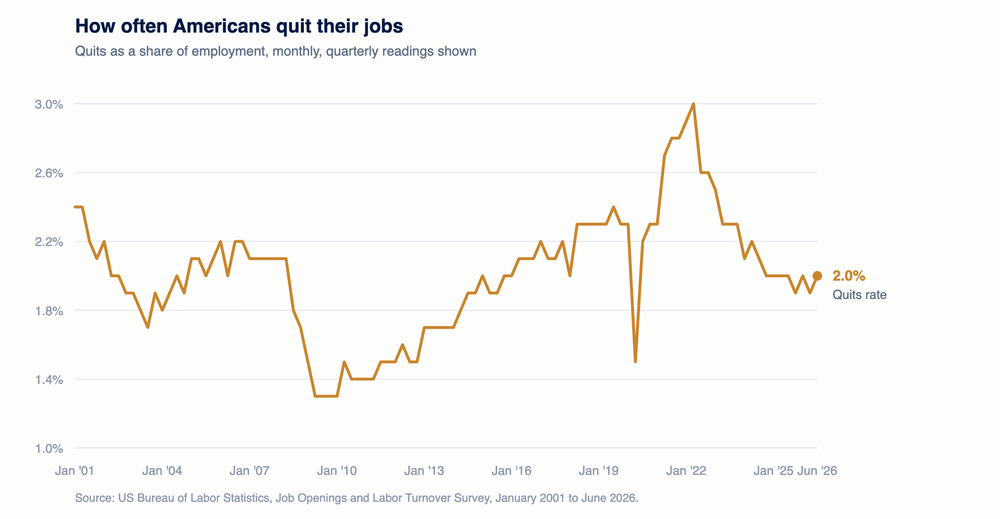
It was 2.0% in June. It has been between 1.9% and 2.2% every month for 31 months.
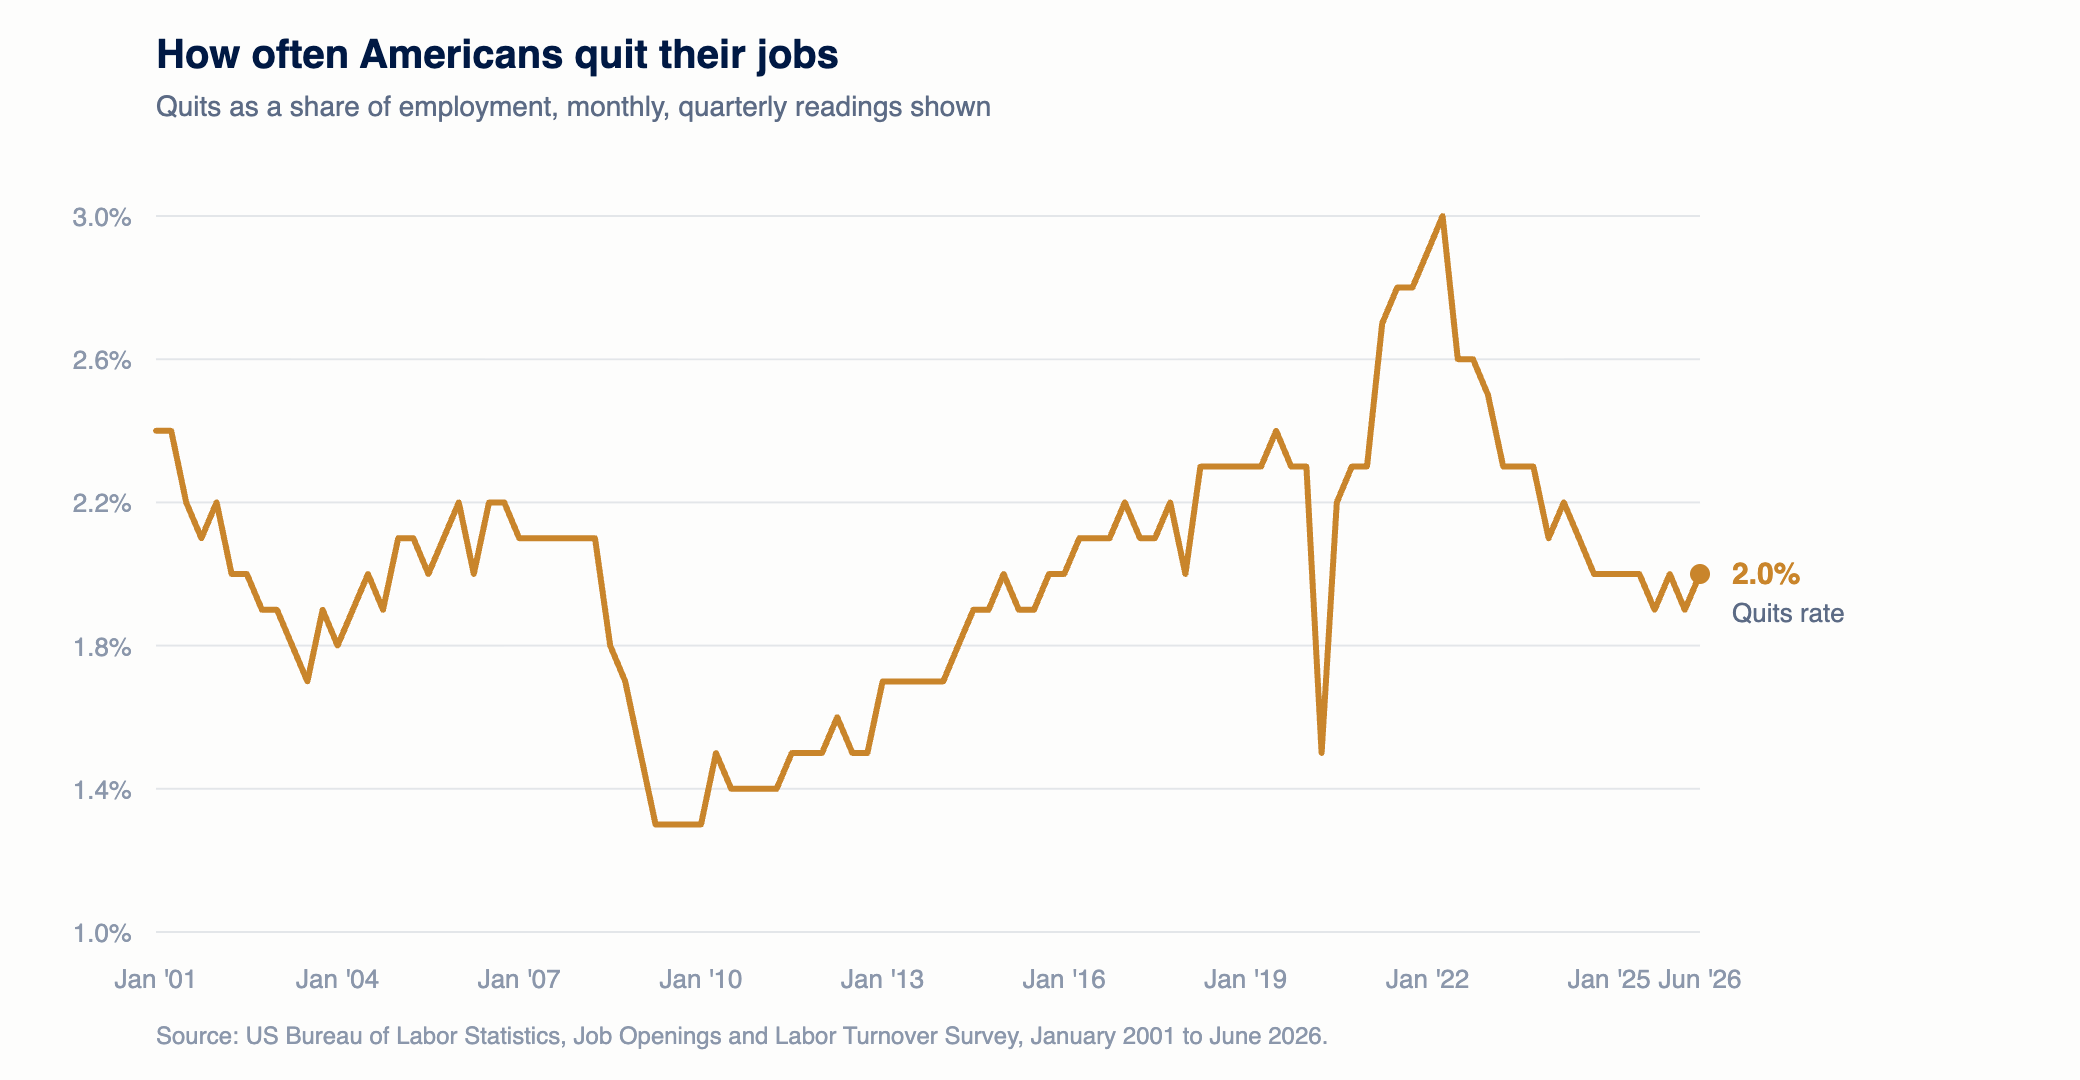
The long view puts that in context. Quits ran between 2.0% and 2.4% through the mid 2000s. They collapsed to 1.3% in 2009 and stayed under 2% until 2014. They peaked at 3.0% in November 2021. They averaged 2.32% through 2019.
Over the last twelve months they have averaged 1.97%. Voluntary movement is running about 15% below its pre-pandemic normal and has been stuck there long enough that it now reads as the baseline rather than as a departure from one.
Low quitting used to mean something worse
This is where the historical record does the work.
Since December 2000 there have been 160 months with a quits rate at or below 2.0%. In 127 of them, four out of five, the layoff and discharge rate was 1.3% or higher.
That is the normal relationship. People stop leaving voluntarily when they can see other people being let go involuntarily. Fear and stillness travel together, and almost every previous stretch of low quitting in this series came with elevated firing.
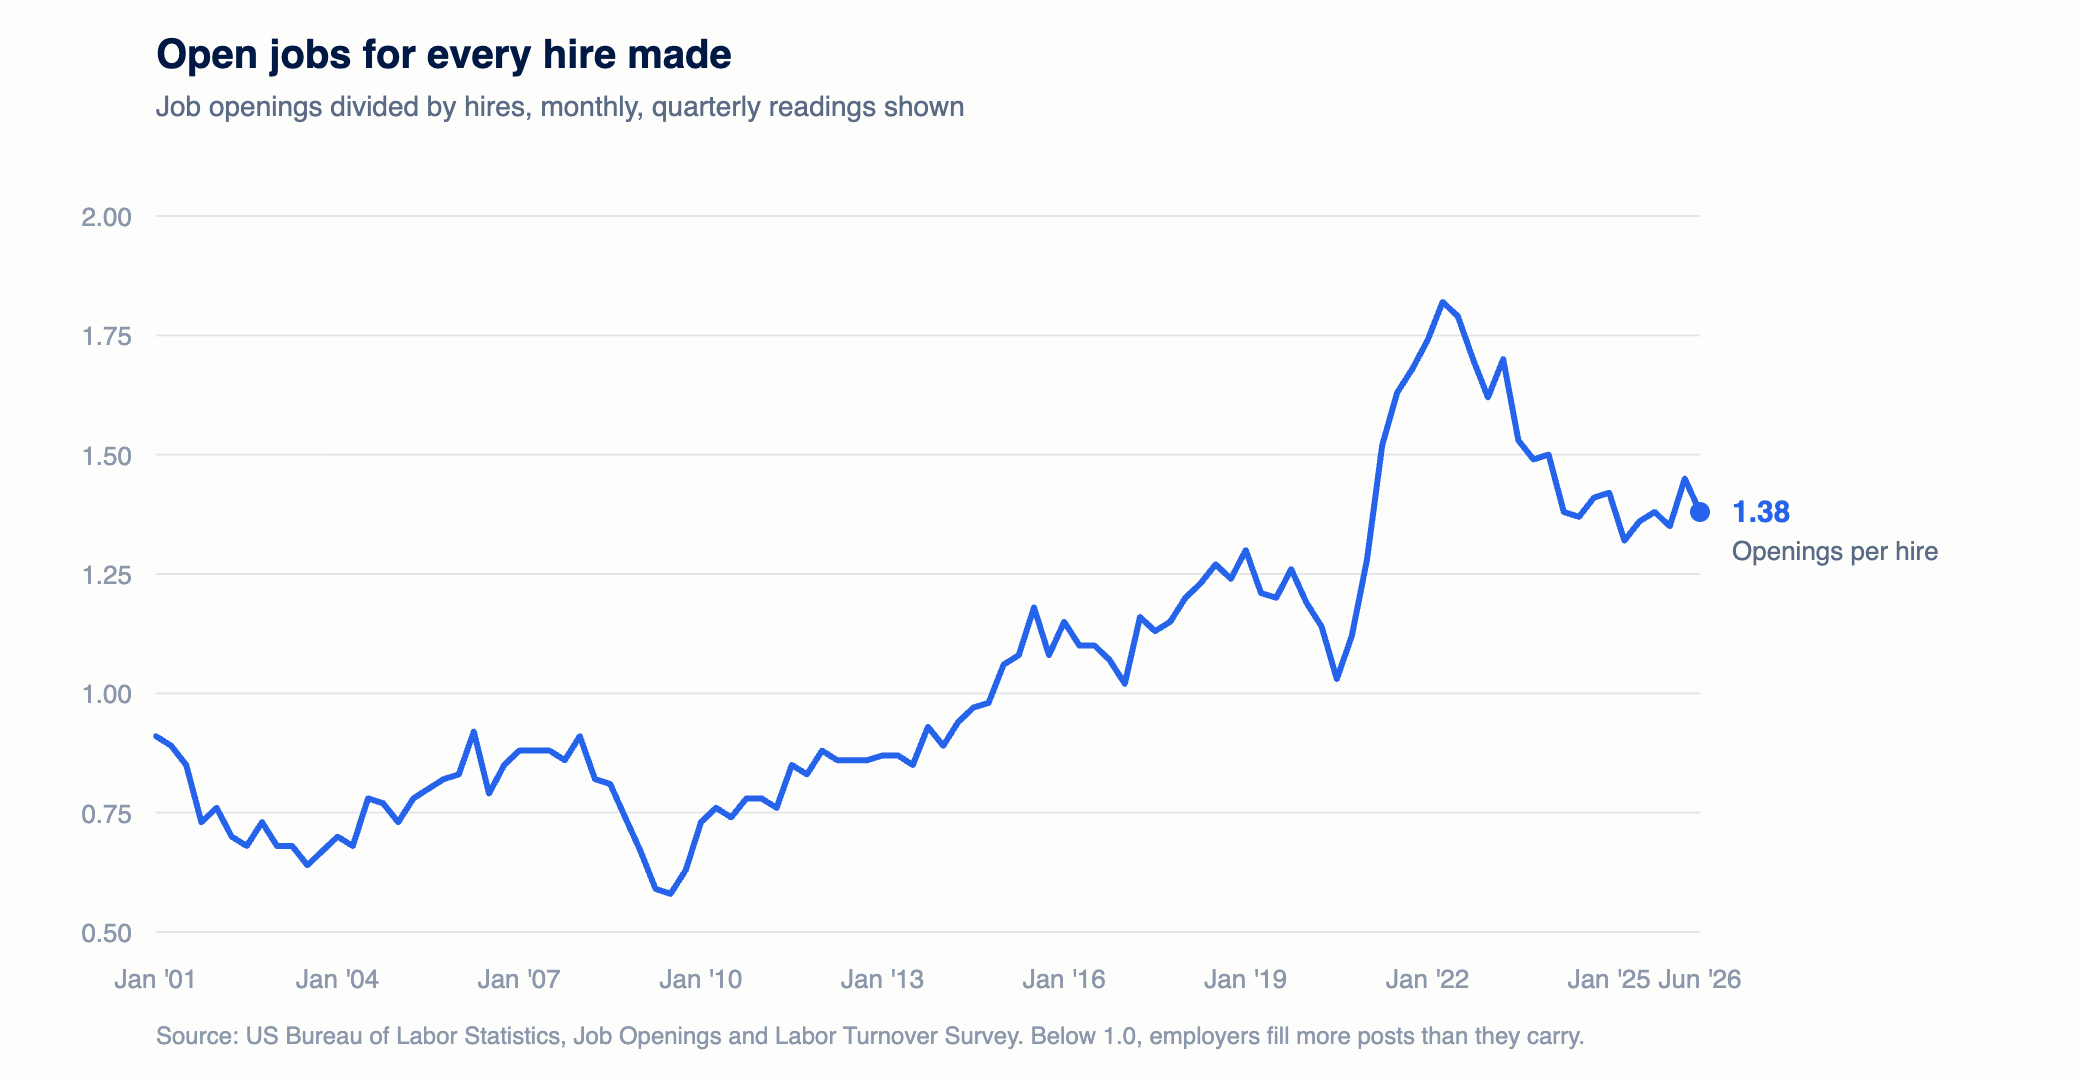
Compare the two periods directly. Across 2009 and 2010 the quits rate averaged 1.38%, hires 3.08%, layoffs 1.58% and the openings rate 2.05%. Over the past twelve months quits averaged 1.97%, hires 3.30%, layoffs 1.10% and openings 4.29%.
On the worker side today looks like a weak market: quits well below the 2019 norm, hires well below it. On the employer side it looks like a healthy one: layoffs below 2019, openings not far off it. In 2009 both sides were bad together, which is what a recession looks like in this data.
There is no clean precedent in twenty-five years for a market where employers are neither cutting nor filling and workers are not moving. That is the actual finding, and it is more unusual than any individual number in the release.